
Figure 4.
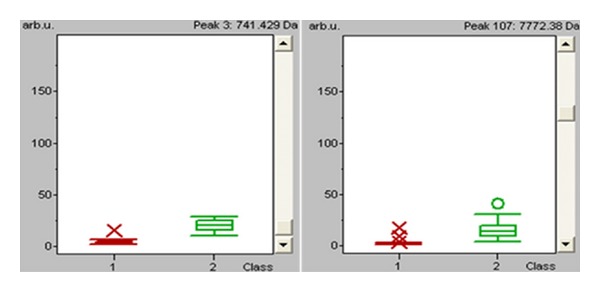
Box-and-whiskers plot calculated from the areas of the two signals used in the cluster for the two studied populations. Red represents colorectal cancer, green represents healthy volunteers.
Official websites use .gov
A
.gov website belongs to an official
government organization in the United States.
Secure .gov websites use HTTPS
A lock (
) or https:// means you've safely
connected to the .gov website. Share sensitive
information only on official, secure websites.
Box-and-whiskers plot calculated from the areas of the two signals used in the cluster for the two studied populations. Red represents colorectal cancer, green represents healthy volunteers.