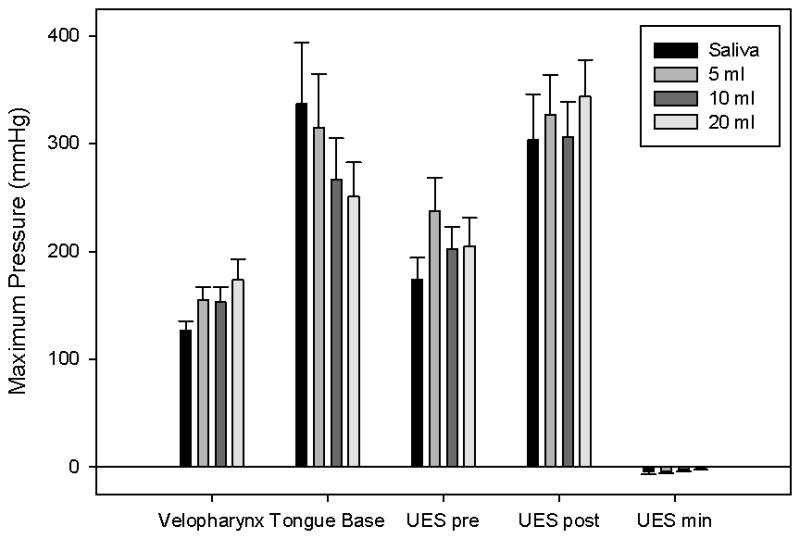
Figure 1.

Bar charts displaying average maximum pressure in the three areas of interest. Error bars represent standard error of the mean. Maximum tongue base pressure decreased, while maximum velopharyngeal pressure increased with bolus volume. Upper esophageal sphincter (UES) pressure before and after opening showed no consistent trend.
