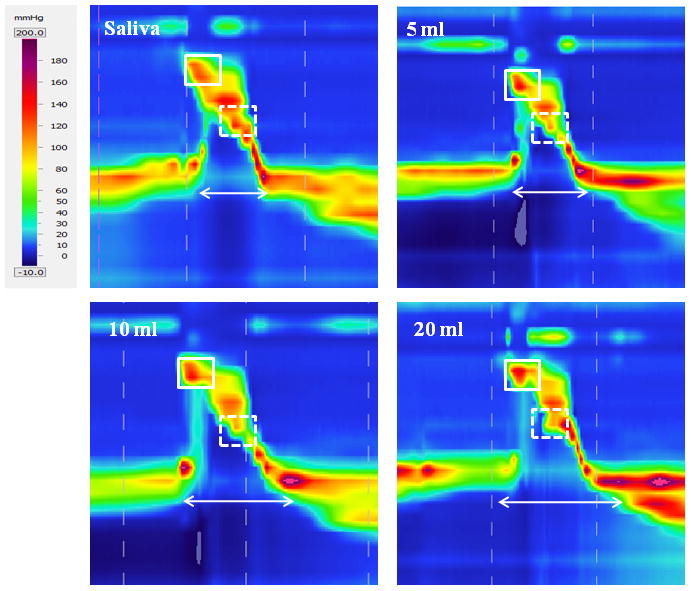
Figure 3.

Spatiotemporal plots displaying swallows at each volume from one subject. As bolus volume increased, velopharyngeal pressure (box with solid lines) and upper esophageal sphincter activity time (arrow) increased while tongue base pressure decreased (box with dashed lines).
