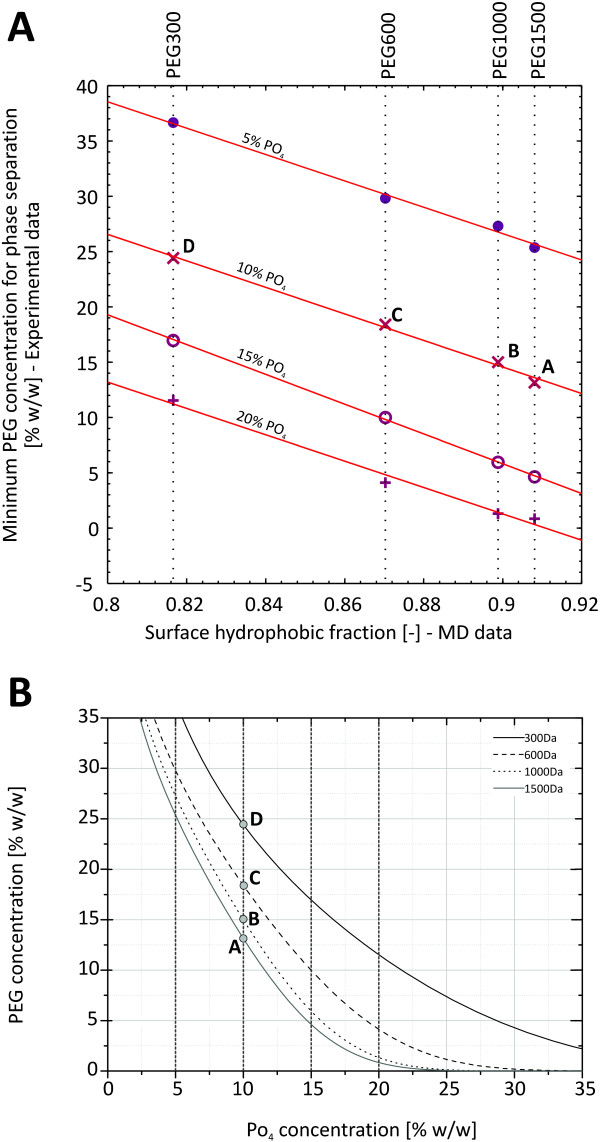
Figure 6.
Relationship between surface hydrophobicity and two phase formation. Experimentally determined PEG concentration needed for two-phase formation of four different PEG molecular weights at four concentrations of PO4 plotted over the surface hydrophobic fraction of the corresponding PEG molecules determined from MD simulations. Phase formation in the presence: ●5% PO4, ×10% PO4, ∘15% PO4, + 20% PO4. B: Experimentally determined binodals of PEG-PO4 ATPSystems. Dashed lines represent the levels of PO4 concentration at which the minimum concentration of PEG needed for phase separation was determined. The data point labeled “A”, “B”, “C”, and “D” are the same points on the binodals in both subfigures

