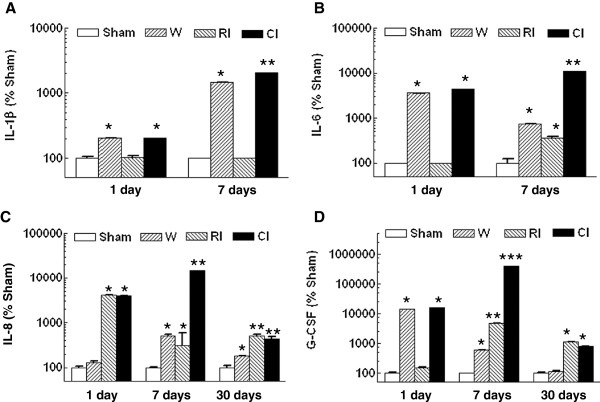
Figure 7.
Combined injury increased radiation-induced cytokine elevation. N = 6 mice per group. For panel A, at 1 day: *P < 0.05 vs. sham and RI groups; at 7 days: *P < 0.05 vs. sham, RI, and CI groups; **P < 0.05 vs. sham, wounded, and RI groups. For panel B, at 1 day: *P < 0.05 vs. sham and RI groups; at 7 days: *P < 0.05 vs. sham and CI groups; **P < 0.05 vs. sham, wounded, and RI groups. For panel C, at 1 day: *P < 0.05 vs. sham and wounded groups; at 7 days: *P < 0.05 vs. sham and CI groups; **P < 0.05 vs. sham, wounded, and RI groups; at 30 days: *P < 0.05 vs. sham, RI, and CI groups; **P < 0.05 vs. sham and wounded. For panel D, at 1 day: *P < 0.05 vs. sham and RI groups; at 7 days: *P < 0.05 vs. sham, RI, and CI groups; **P < 0.05 vs. sham, wounded, and CI groups; ***P < 0.05 vs. sham, wounded, and RI groups; at 30 days: *P < 0.05 vs. sham and wounded. W; wounded; RI: radiation injury at 9.75 Gy for 1 day and 7 days and 9.25 Gy for 30 days; CI: combined injury.

