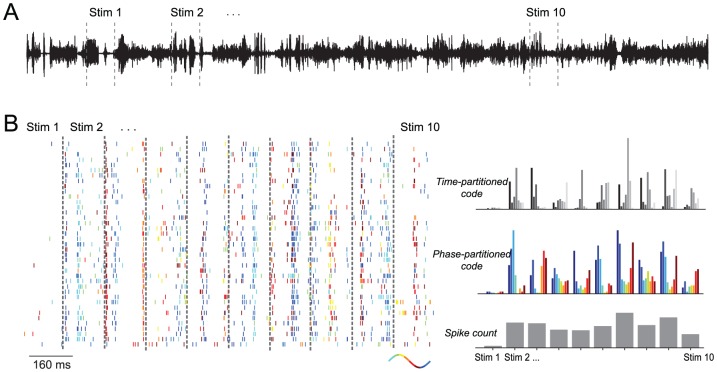
Figure 2. Example data from an auditory cortex neuron illustrating responses in each code.
A) Sound wave of the 52 sec acoustic stimulation sequence consisting of various natural and environmental sounds. Dashed lines illustrate the random selection of 10 epochs from the long sound sequence as used for the decoding analysis (epoch duration not to scale). B) Data from one example neuron showing the spike raster (left) and the average response patterns for the three codes (right). The spike raster displays the response to multiple repeats of ten stimulus epochs (concatenated for display purposes). Spikes are color-coded with the phase of the theta (2–6 Hz) band oscillation at the time of spike. The average responses illustrate the trial-averaged responses for each code. Colors indicate the phase bins, gray-scales indicate the time bins.

