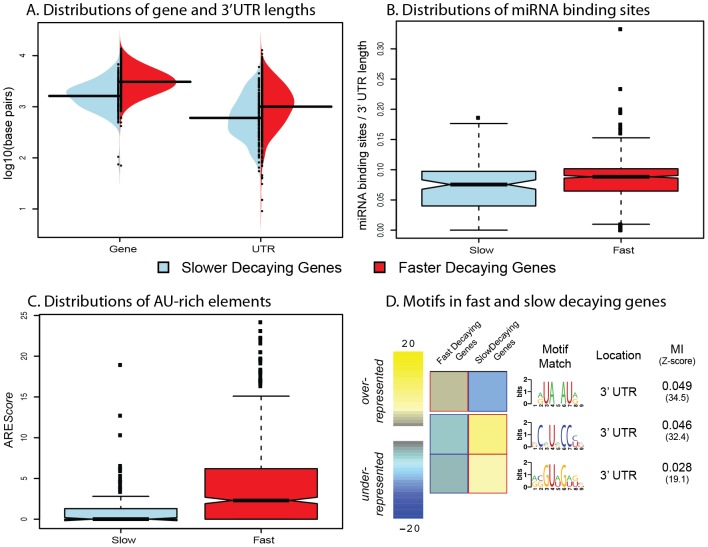
Figure 2. Genomic features influencing variation in decay rates across genes.
A. Distributions of gene length (left) and 3′UTR length (right) for genes decaying slower (blue) or faster (red) than average. B. Distributions of the number of miRNA binding sites (normalized by 3′UTR length; y-axis) for genes decaying slower (blue) or faster (red) than average. C. Distributions of AREScores (y-axis) for genes decaying slower (blue) or faster (red) than average. D. Motifs that are significantly over- (yellow) or under-represented (blue) in fast or slow decaying genes. The MI refers to the mutual information score from the FIRE algorithm.

