
Figure 2. Faster-X evolution of gene expression measured in head.
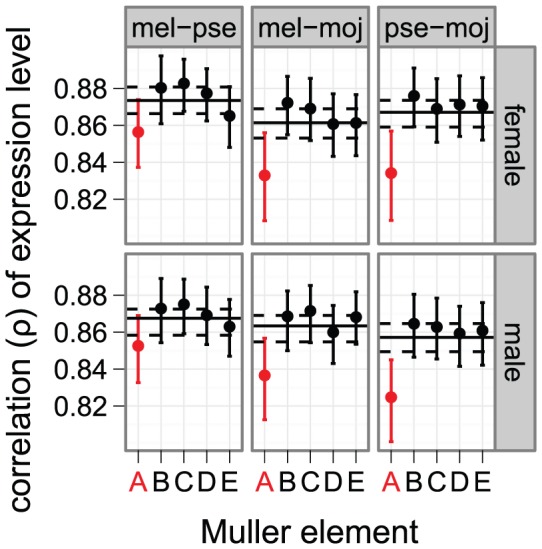
Gene expression measurements from head using microarrays were used to calculate the correlation of expression levels between D. melanogaster (mel), D. pseudoobscura (pse), and D. mojavensis (moj). Expression was measured in females (top) and males (bottom). Graphs are the same as in Figure 1.