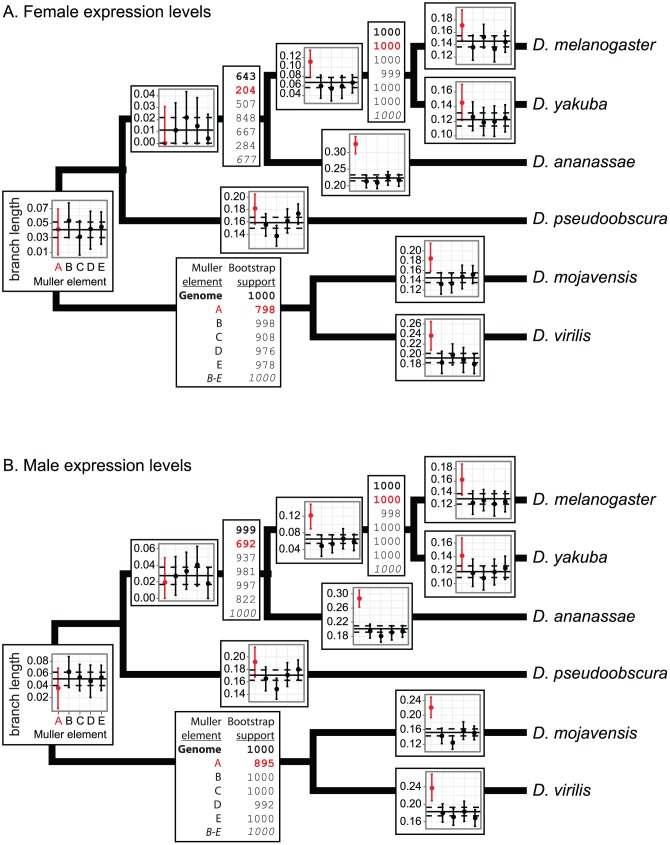
Figure 4. Branch length estimates and bootstrap support from expression level divergence.
Overlaid on each branch of the phylogeny are the branch lengths estimated from the pairwise correlations in expression (measured in whole flies with microarrays) using the Fitch and Margoliash [115] method. In each graph, the solid horizontal line is the genome-wide branch length, and the dashed lines are the 95% CI. Each point represents the branch length estimate for a chromosome arm (X is in red), and the error bars are the 95% CI. Bootstrap supports for the nodes are listed in the boxes adjacent to the nodes. The first number, in bold, is the bootstrap support using all orthologs, and the subsequent five values are for genes on each chromosome arm (X is in red). The last value, in italics, is the bootstrap support using genes on the four autosomes (Muller elements B–E). Chromosome arms are represented with their Muller element nomenclature, as described in Figure 1. The Fitch and Margoliash algorithm treats the phylogeny as unrooted, so there is a single branch length and bootstrap value for the lineage connecting the Sophophora (D. melanogaster, D. yakuba, D. ananassae, and D. pseudoobscura) and Drosophila (D. mojavensis and D. virilis) subgenera. Branch lengths and bootstrap support were estimated using expression measurements from (panel A) females and (panel B) males.

