
Figure 3. The time dependent distribution of oligomer mass, which captures the growth of individual fibers during one simulation with 0.51 mM peptide concentration.
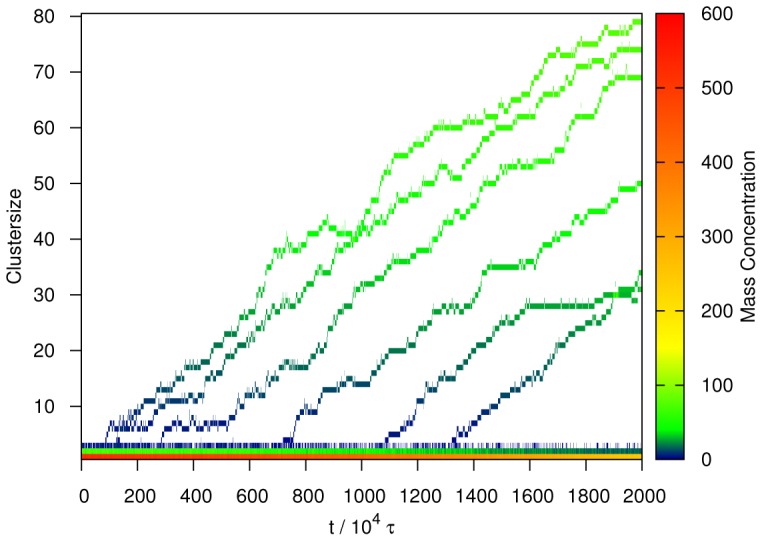
At the bottom, one can see the decreasing concentration of monomers (red/yellow), dimers (green/blue) and trimers (blue). Importantly, tetramers developed into a full fiber in every case. Only the beginning of the simulation is shown for clarity.