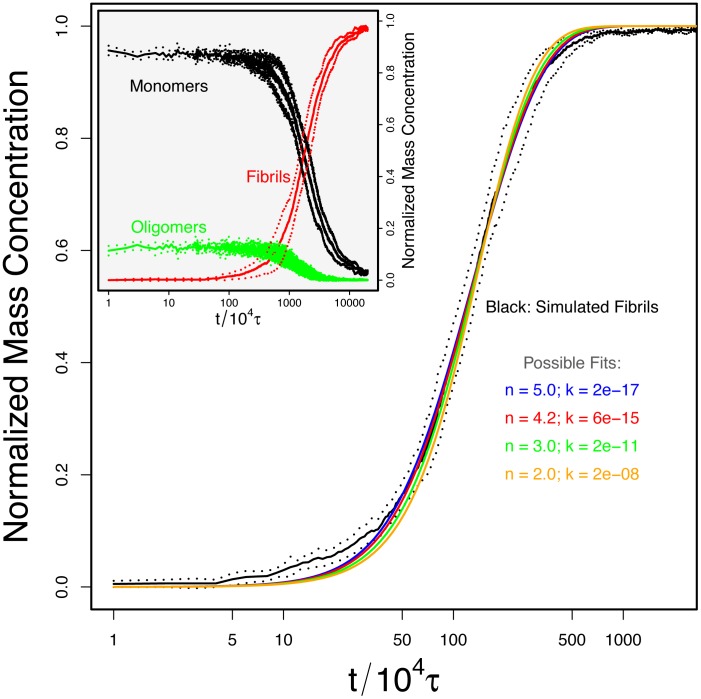
Figure 4. The fibrillar growth from our simulation fitted by Oosawa's theory with varying nucleation size.
All the theoretical curves displayed with non-black colors were able to fit the simulation data very well by varying the growth rate from  to
to  and the nucleus size from 2.0 to 5.0; this overfitting can only be resolved by performing global fits as shown in Fig. 5. The inset shows the time evolution of the mass concentrations of monomers (black), oligomers (dimers and trimers, green) and fibrils (aggregates with an aggregation number greater than four, red) for a simulation with a concentration 0.51 mM. The dots display the standard deviation calculated from the averaging of the five runs with different random initial configurations.

