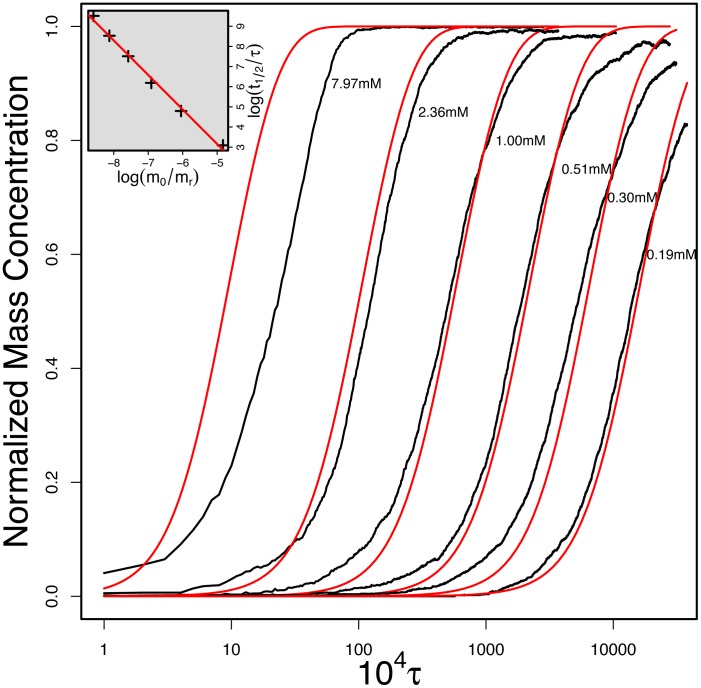
Figure 5. The fibril growth from our simulation and corresponding fit by Oosawa's theory.
The peptide concentrations are from left to right 7.97, 2.36, 1.00, 0.51, 0.30, and 0.19 mM. The fitted size of nucleus and growth rate are 3.8 particle and  respectively. The inset shows the fit to obtain the nucleus size
  via the halftimes according to Eq. 2. The logarithmic time scale tends to visually over-emphasize the differences between the global fit (red curve) and data (black curve) at short time (highest concentrations).

