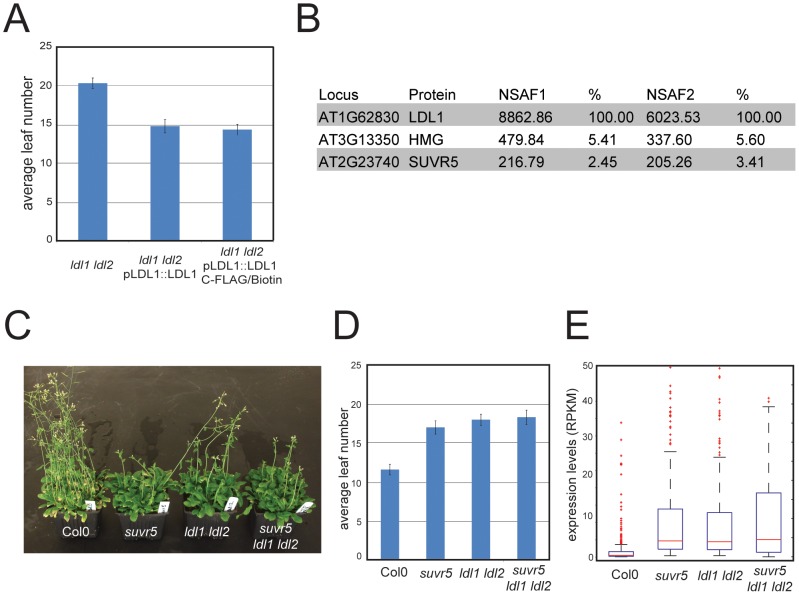
Figure 5. SUVR5 and LDL1 act together in a repressor complex.
a, analysis of the late flowering phenotype of ldl1 ldl2 mutants and its complementation by the tagged LDL1 transgene measured by scoring number of leaves at bolting; b, table showing the mass spectrometry analyses of LDL1 affinity purifications; c, picture showing the late flowering phenotype of suvr5, ldl1 ldl2 and suvr5 ldl1 ldl2 plants; d, analysis of the late flowering phenotype by scoring number of leaves at bolting; e, box plot showing the expression level (in RPKM) of the 270 genes upregulated in suvr5 and ldl1 ldl2 (over 4 fold and P<0.01 for both, suvr5/Col-0 and ldl1 ldl2/Col-0) in Col-0, suvr5, ldl1 ldl2 and the triple suvr5 ldl1 ldl2 mutants, showing the epistatic relationship between the mutants.

