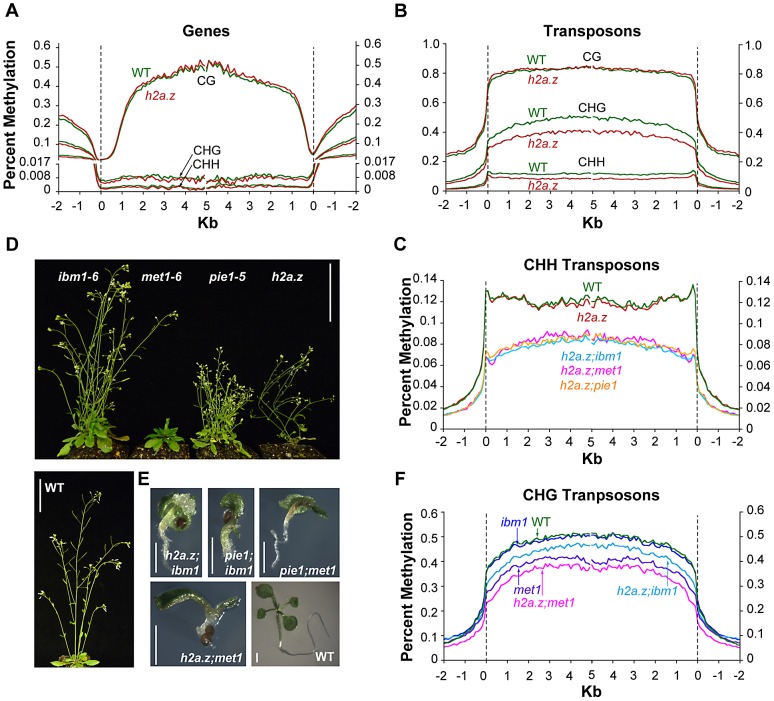
Figure 3. DNA methylation profiles of h2a.z-related mutants.
(A) Profiles of CG, CHG, and CHH DNA methylation in two replicates each of cauline leaf h2a.z and WT. Genes were aligned at the 5′ end (left half of panel) and the 3′ end (right half of panel) and average methylation levels for each 100-bp interval are plotted from 2 kb away from the gene (negative numbers) to 5 kb into the gene (positive numbers). WT methylation is represented by the green traces, while h2a.z methylation is represented by red traces. The dashed lines at zero represents the point of alignment. The Y-axis was partitioned at 0.017 and the lower portion expanded to aid in the visibility of CHG and CHH traces. (B) Profiles of CG, CHG, and CHH DNA methylation in transposons in h2a.z and WT, aligned as genes were in (A). WT methylation is represented by the green traces, while h2a.z methylation is represented by red traces. (C) Profiles of average CHH DNA methylation in TEs. TEs were aligned and average methylation levels determined as in (B). WT methylation is represented by the green trace, h2a.z by the red trace, h2a.z;met1 by the pink trace, h2a.z;ibm1 by the light blue trace, and h2a.z;pie1 by the orange trace. (D) Phenotypes of ibm1–6, met1–6, pie1–5, h2a.z and WT plants grown in LD conditions at 6 weeks post germination. Scale bars = 3 cm. (E) Phenotypes of h2a.z;ibm1, h2a.z;met1, pie1;ibm1, pie1;met1 double mutants and WT seedling at 14 days post germination grown in LD conditions. Scale bars = 1 mm. (F) Profiles of average CHG DNA methylation in TEs, as in (C). WT methylation is represented by the green trace, met1 by the purple trace, h2a.z;met1 by the pink trace, and h2a.z;ibm1 by the light blue trace, and ibm1 by the dark blue trace.

