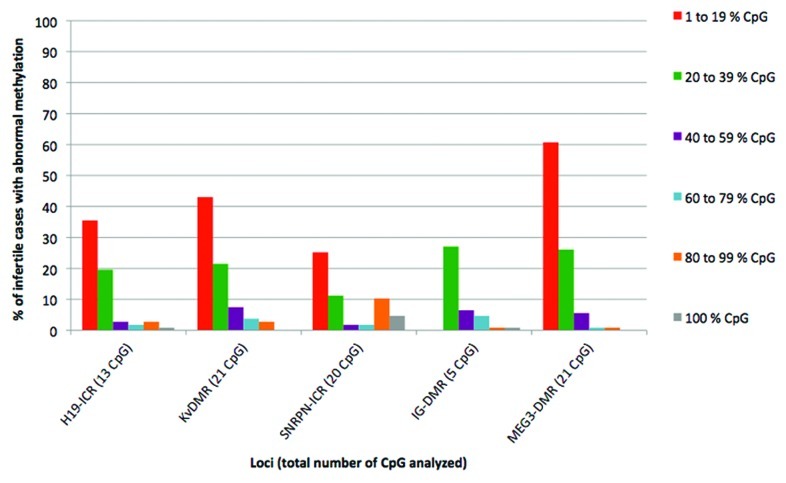
Figure 1. Percentage of infertile individuals showing abnormal methylation values at every single locus. The total percentage of infertile cases with abnormal methylation is broken down according to the percentage of altered CpG. Red, 1 to 19% of abnormal CpG; green, 20 to 39% of abnormal CpG; lilac, 40 to 59% of abnormal CpG; blue, 60 to 79% of abnormal CpG; orange, 80 to 99% of abnormal CpG; gray, 100% of abnormal CpG.

An official website of the United States government
Here's how you know
Official websites use .gov
A
.gov website belongs to an official
government organization in the United States.
Secure .gov websites use HTTPS
A lock (
) or https:// means you've safely
connected to the .gov website. Share sensitive
information only on official, secure websites.
