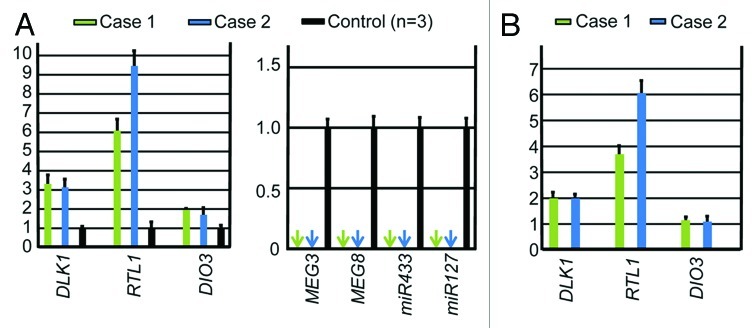
Figure 3. Quantitative real-time PCR analysis using placental samples. For a control, a pooled RNA sample consisting of an equal amount of total RNA extracted from three fresh control placentas was utilized. (A) Relative mRNA expression levels for DLK1, RTL1, and DIO3 against GAPDH (mean ± SE) and lack of MEGs expression (indicated by arrows) (miR433 and miR127 are encoded by RTL1as) in the placental samples of cases 1 and 2. (B) Relative mRNA expression levels for DLK1, RTL1, and DIO3 against GAPDH (mean ± SE), in the equal amount of expression positive placental cells (vascular endothelial cells and pericytes) of cases 1 and 2 (corrected for the difference in the relative proportion of expression positive cells between the placental samples of cases 1 and 2 and the control placental samples, on the assumption that the DLK1 expression level is ″simply doubled″ in the expression positive placental cells of case 1 and 2).

An official website of the United States government
Here's how you know
Official websites use .gov
A
.gov website belongs to an official
government organization in the United States.
Secure .gov websites use HTTPS
A lock (
) or https:// means you've safely
connected to the .gov website. Share sensitive
information only on official, secure websites.
