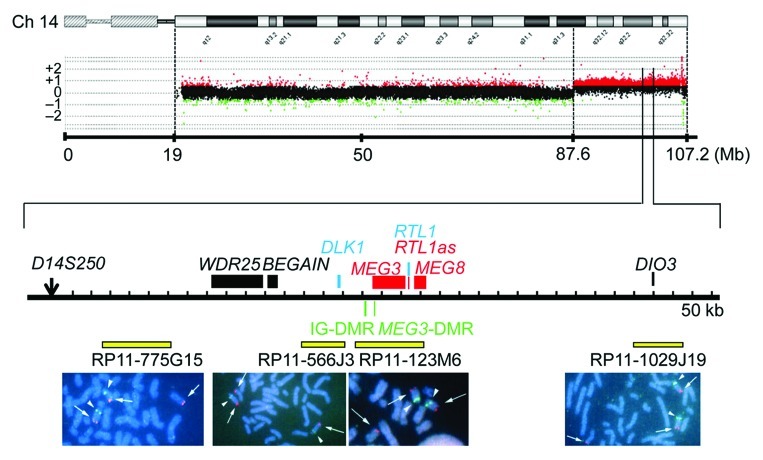
Figure 4. Array CGH and FISH analysis for the distal chromosome 14 region in case 4. In CGH analysis, the black, the red, and the green dots denote signals indicative of the normal, the increased (> +0.5), and the decreased (< –1.0) copy numbers, respectively. In FISH analysis, red signals (arrows) are derived from the probes detecting the various parts of the 14q32.2 imprinted region (the physical positions are indicated with yellow bars), and the green signals (arrowheads) are derived from an RP11–566I2 probe for 14q11.2 used as an internal control.

An official website of the United States government
Here's how you know
Official websites use .gov
A
.gov website belongs to an official
government organization in the United States.
Secure .gov websites use HTTPS
A lock (
) or https:// means you've safely
connected to the .gov website. Share sensitive
information only on official, secure websites.
