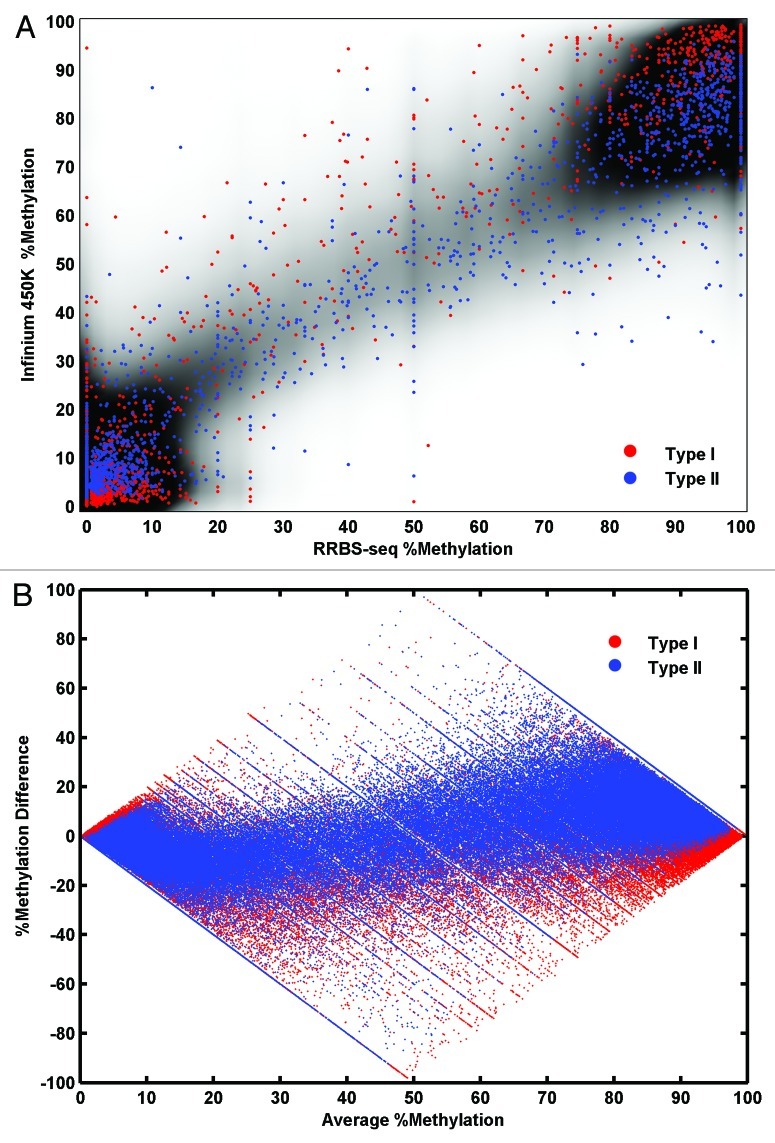
Figure 4. The concordance of Raw Infinium 450K data vs. RRBS data (A) A scatter plot of % methylation values from RRBS (x-axis) and % methylation values from Infinium 450K (y-axis) over a density cloud. Density cloud is generated by the smoothed two-dimensional histogram using 50 equally spaced bins in both directions. A random selection of 2000 data from type I probes is plotted as red dots and another random selection of 2000 data from type II probes is plotted as blue dots. (B) Bland-Altman plot for raw Infinium data compared with RRBS Nreads ≥ 4. Average % methylation at each CpG from both methods is on the x-axis. Difference in % at each CpG over the two methods is on the y-axis. Data from Type I assays is shown in red, type II is shown in blue.

An official website of the United States government
Here's how you know
Official websites use .gov
A
.gov website belongs to an official
government organization in the United States.
Secure .gov websites use HTTPS
A lock (
) or https:// means you've safely
connected to the .gov website. Share sensitive
information only on official, secure websites.
