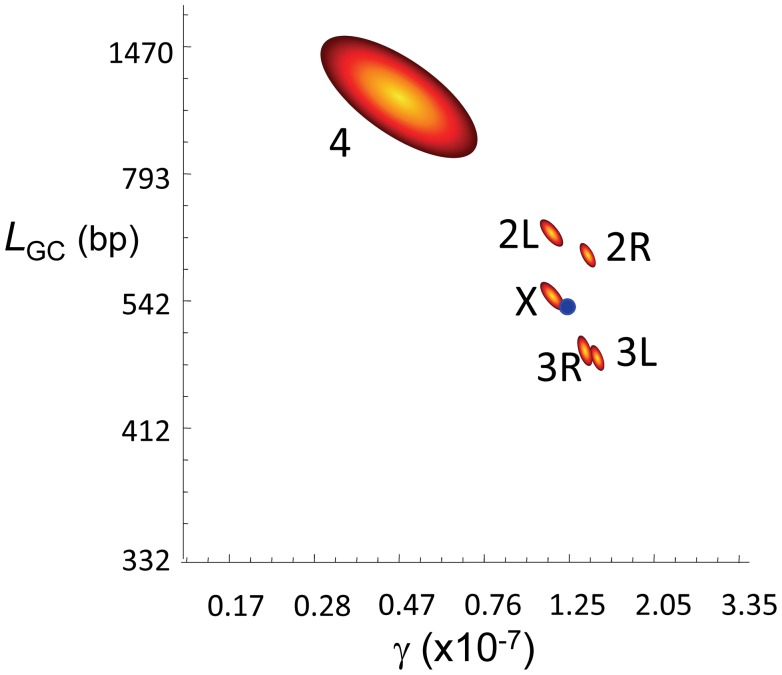
Figure 4. Gene conversion estimates in D. melanogaster.
Joint maximum-likelihood estimates (MLE) of the rate of gene conversion initiation (γ) and mean gene conversion tract length (L GC) in D. melanogaster. γ units are per bp and female meiosis, and L GC in bp. Red/yellow contours represent 95 confidence intervals for γ and L GC for each chromosome arm independently. The blue dot represents the genome average for γ and L GC based on a total of 74,453 observed GC events.

