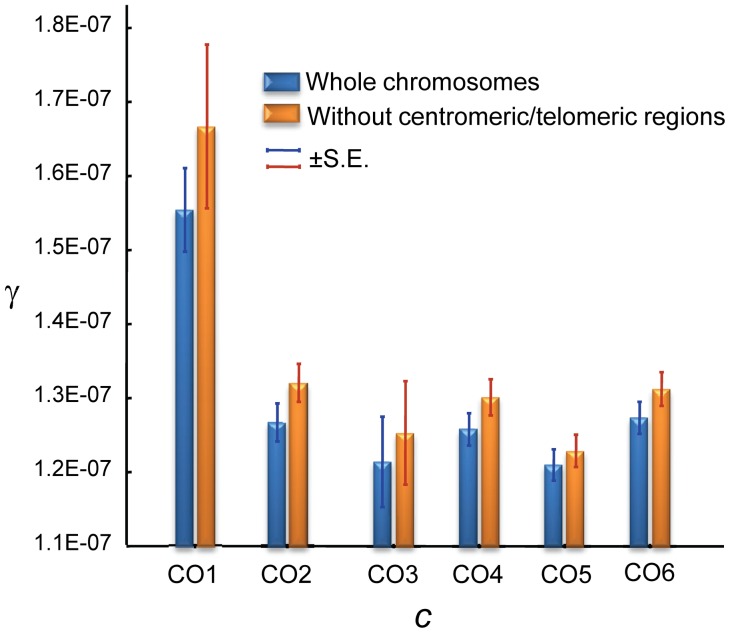
Figure 8. Relationship between crossing over (c) and gene conversion (γ) rates across the D. melanogaster genome.
c and γ based on 100-kb adjacent windows with windows grouped into 6 categories of equal number according to c [CO1, CO2, .., CO6 indicating increasing rates of c] The average c (cM/Mb/female meiosis) values for the six categories is: 0.078 (CO1), 0.727 (CO2), 1.439 (CO3), 2.294 (CO4), 3.299 (CO5) and 5.964 (CO6). Blue columns show results when whole chromosomes are analyzed. Orange columns show results after removing centromeric and telomeric regions with visibly reduced CO rates. There is a significant negative relationship between c and γ using independent (non-overlapping) 100-kb windows: Spearman's R = −0.1246 (P = 1.6×10⁻⁵) for whole chromosomes and R = −0.1191 (P = 1.2×10⁻⁴) after removing telomeric/centromeric regions.

