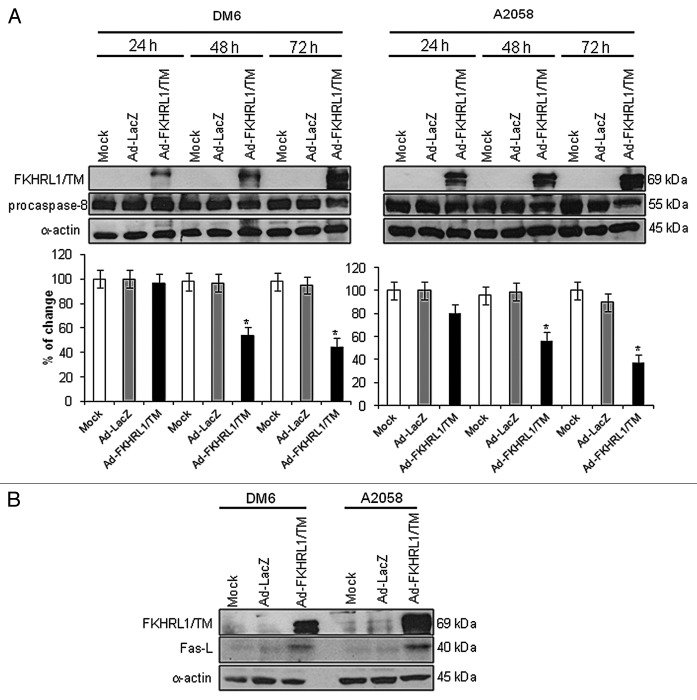
Figure 3. Activation of Fas/Fas-L pathway by FKHRL1/TM in melanoma cells. DM6 or A2058 cells were infected with either Ad-LacZ or Ad-FKHRL1/TM at an MOI of 100 or not infected (Mock); cells were harvested at 24, 48, and 72 h post-infection. (A) Western blot and bar graphs of procaspase-8 expression after adenovirus infection. Bars represent mean ± SEM expressed as percentage of change from three separate experiments, (*p < 0.05) decrease in the level of expression. (B) Western blot and bar graphs of Fas-L expression at 72 h after adenovirus infection. Bars represent mean ± SEM expressed as percentage of change from 3 separate experiments, (*p < 0.05) increase in the level of expression. α-Actin was used to demonstrate equal loading for each lane.

An official website of the United States government
Here's how you know
Official websites use .gov
A
.gov website belongs to an official
government organization in the United States.
Secure .gov websites use HTTPS
A lock (
) or https:// means you've safely
connected to the .gov website. Share sensitive
information only on official, secure websites.
