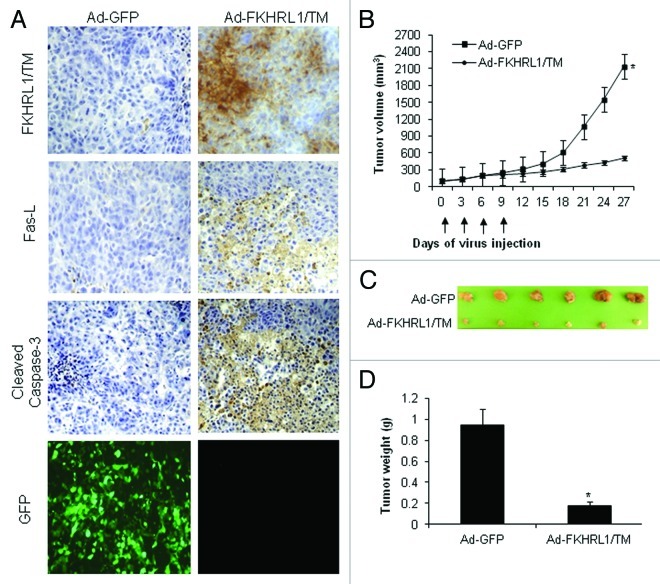
Figure 6. Immunohistochemistry and antitumor effect of treatment with adenovirus expressing FKHRL1/TM. After subcutaneous administration of 5 × 10⁶ A2058 cells, mice with palpable tumors were randomized to receive a local injection of Ad-GFP or Ad-FKHRL1/TM on days 0, 3, 6, and 9 (vertical arrows) at a concentration of 1 × 10⁹ pfu (plaque forming units). (A) Immunohistochemistry of A2058 melanoma tumors at 24 h after last treatment with Ad-GFP or Ad-FKHRL1/TM. GFP expression was visualized by fluorescence microscopy. FKHRL1/TM, Fas-L, and cleaved caspase-3 expressions were detected by immunohistochemistry. (B) Tumor volume was plotted over time. Volume (V) was determined by V = (L × W 2)/2 of tumor measured using calipers. (C) On day 27, tumors were excised and photographed. The relative size of tumors is shown. (D) Tumors were also weighed on day 27. The results are expressed as the mean ± SEM for each treatment group. The differences in tumor size and weight in animals treated with Ad-FKHRL1/TM were statistically significant on day 27 compared with Ad-GFP control (*p < 0.05).

An official website of the United States government
Here's how you know
Official websites use .gov
A
.gov website belongs to an official
government organization in the United States.
Secure .gov websites use HTTPS
A lock (
) or https:// means you've safely
connected to the .gov website. Share sensitive
information only on official, secure websites.
