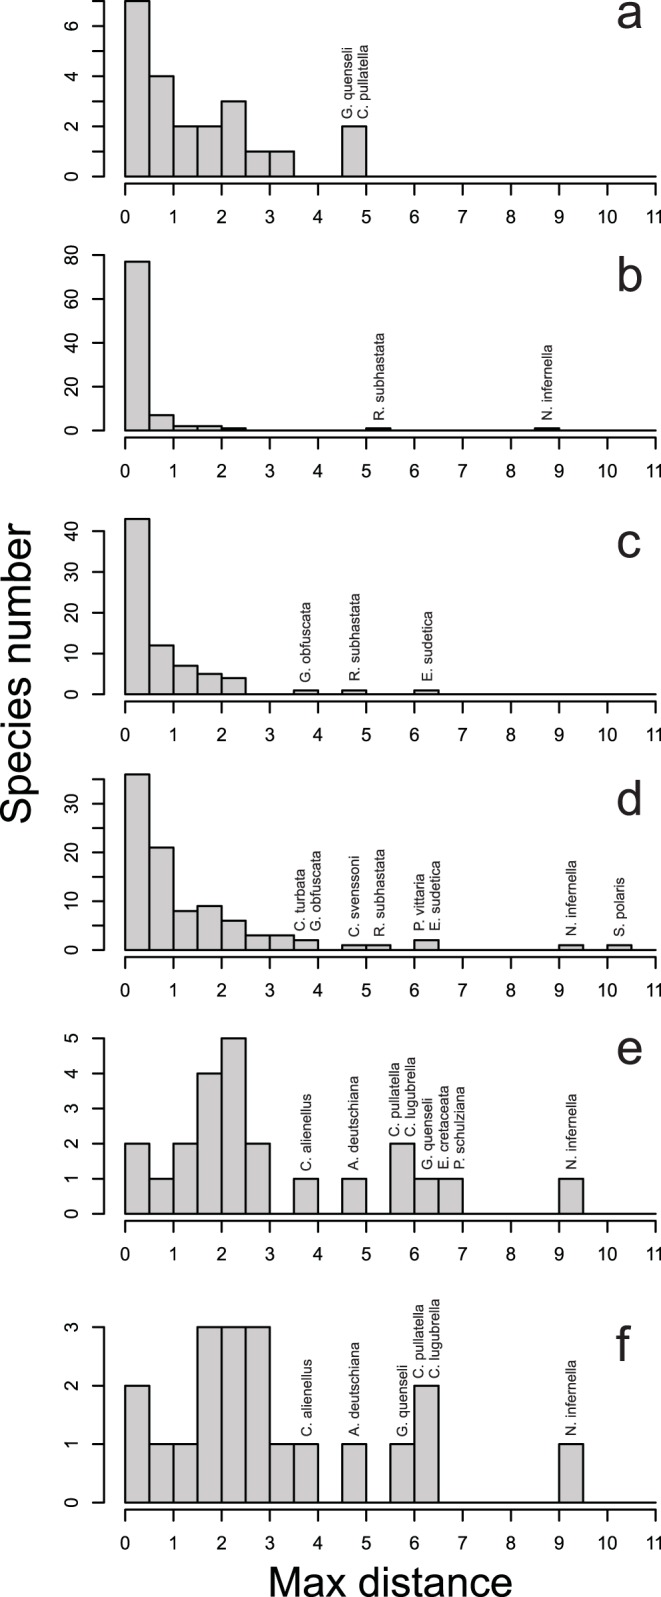
Figure 2. Distributions of maximum intraspecific barcode divergences (MAX) within and between the study regions.

The x-axis shows MAX values in percentage. 2A. within North America, 2B. within Fennoscandia, 2C. within Alps, 2D. between Alps and Fennoscandia, 2E. between Alps and North America, 2F. between Fennoscandia and North America. Species showing over 4% intraspecific divergence are indicated above the bars.
