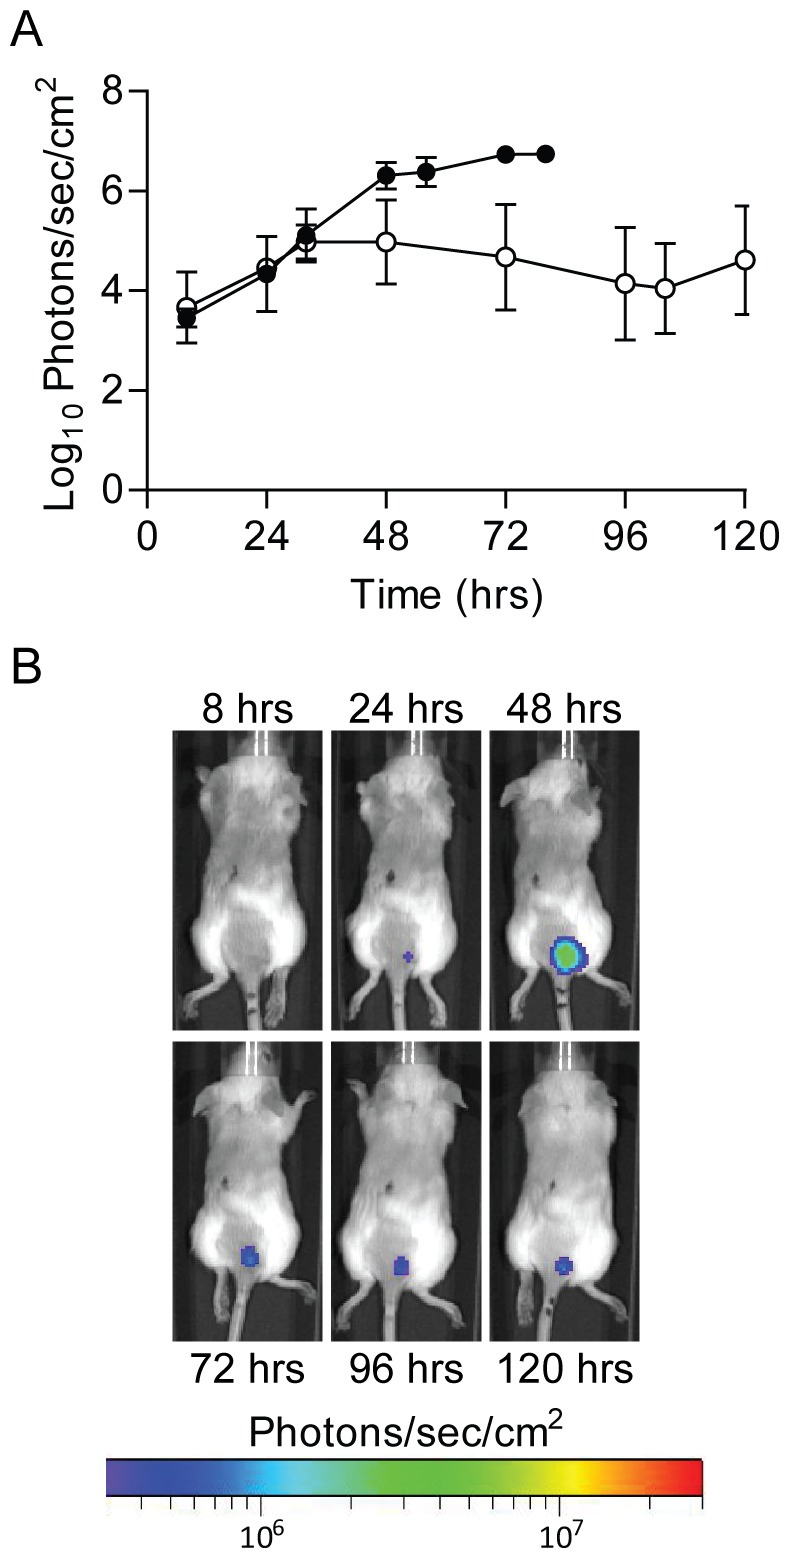
Figure 7. Continued bioluminescence from inoculation site.

Mice were infected with ∼200 CFU of WT (n = 5) or Δpla (n = 5) Y. pestis LuxPcysZK subcutaneously at the base of the tail and imaged using an IVIS Spectrum. (A) The average bioluminescence detected from the inoculation site was determined over the course of the infection. Black and white symbols represent animals infected with WT or Δpla Y. pestis, respectively. (B) Sequential images from a representative animal infected with Δpla Y. pestis LuxPcysZK.
