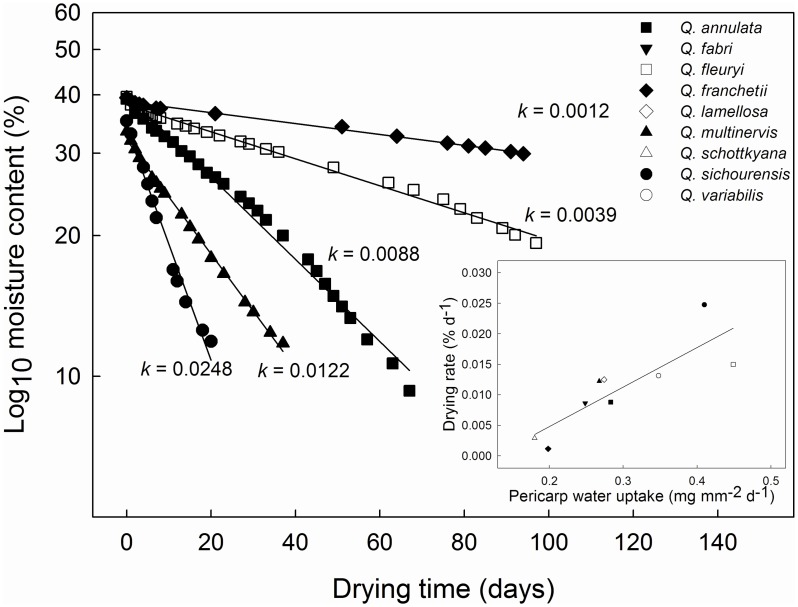
Figure 2. Representative drying curves for fruits of 5 Quercus species.
The presented curves span the entire range of drying rates observed for the full 9 species. For each species, 37 fruits were desiccated at 15°C using silica gel. The slopes of the fitted lines (k) are given on the figure. Inset: the relationship between drying rates (k) and rates of water uptake for fresh fruits of the 9 Quercus species imbibed in water for 24 h.

