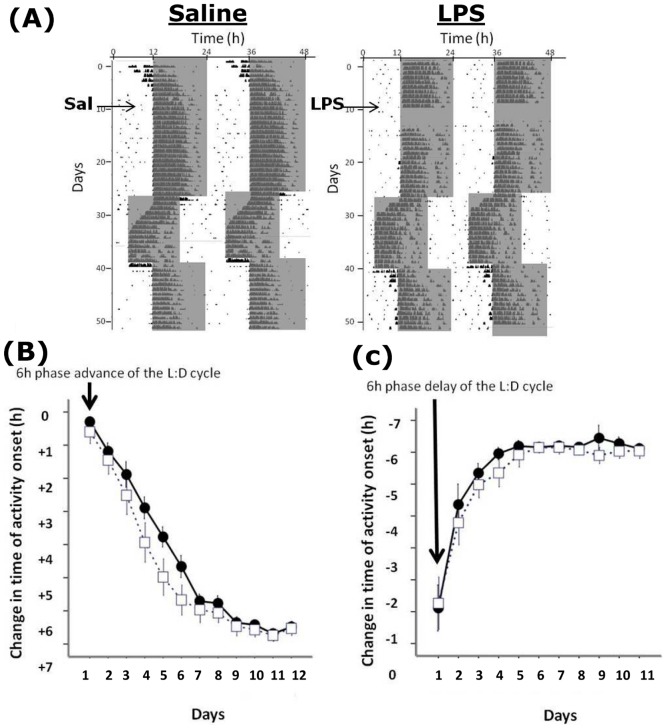
Figure 1. Entrainment to L∶D cycles and re-entrainment to shifts in the L∶D cycle.
(A) Sample double plotted actograms from a control and a LPS treated animal. The shaded area is the dark phase of the L∶D cycle. Note the suppression of wheel running activity for a number of cycles following LPS treatment, but when activity resumed it did so at the expected phase. Animals were then exposed to a 6 hour advance of the L∶D cycle, and then a 6 hour delay of the L∶D cycle. (B) and (C) show the rates of re-entrainment of the control and LPS animals to the shifted cycles. Note the more rapid adjustment of the activity onsets in the LPS group compared to the controls following the advance (C) but not the delay (D).

