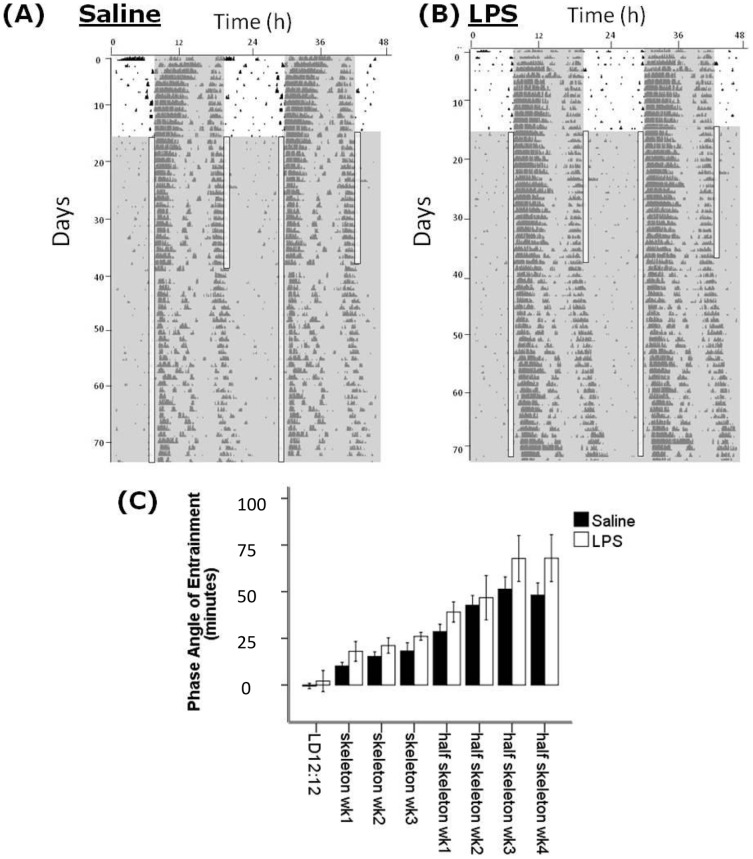
Figure 2. Entrainment to skeleton photoperiods.
(A) and (B) are sample double plotted actograms from a control and a LPS-treated animal respectively showing entrainment to a 12∶12 L∶D cycle, then a 1∶10∶1∶12 skeleton photoperiod and subsequently a 1∶11∶12 half skeleton photoperiod. (C) shows the average phase-angles of entrainment per week of the experiment for the control and LPS groups. There are no significant groupwise differences.

