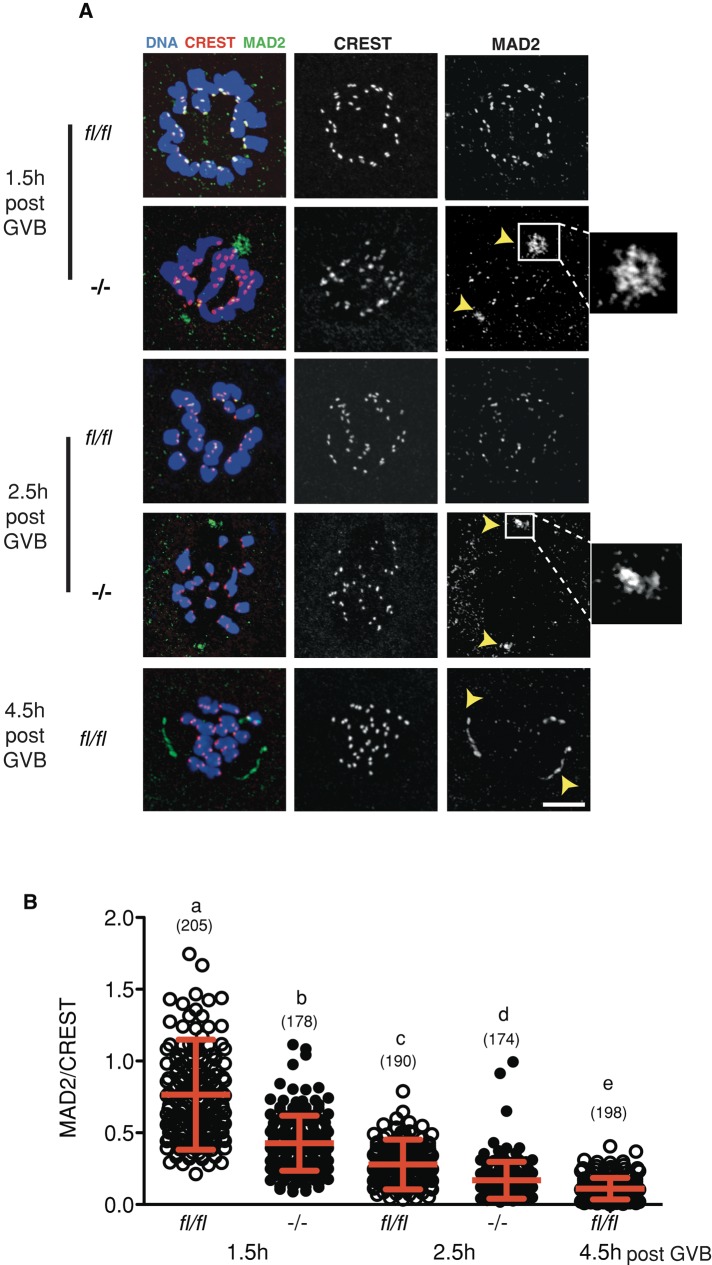
FIGURE 4:
Earlier loss of MAD2 from kinetochores during prometaphase in Fzr1−/− oocytes. (A) Representative confocal z-stack images of MAD2/CREST immunostained in fl/fl and Fzr1−/− oocytes fixed during prometaphase. Arrowheads and insets indicate sites of intense MAD2 accumulation at predicted spindle poles for Fzr1−/− oocytes, similar to fl/fl oocytes at 4.5 h post GVB. (B) Kinetochore MAD2/CREST intensity ratios from at 1.5 and 2.5 h post GVB (p < 0.001; Kruskal–Wallis test with Dunn's post hoc test). Error bars (B) show SD; parentheses show numbers of kinetochores analyzed. Scale bar in A, 10 μm.

