FIGURE 1:
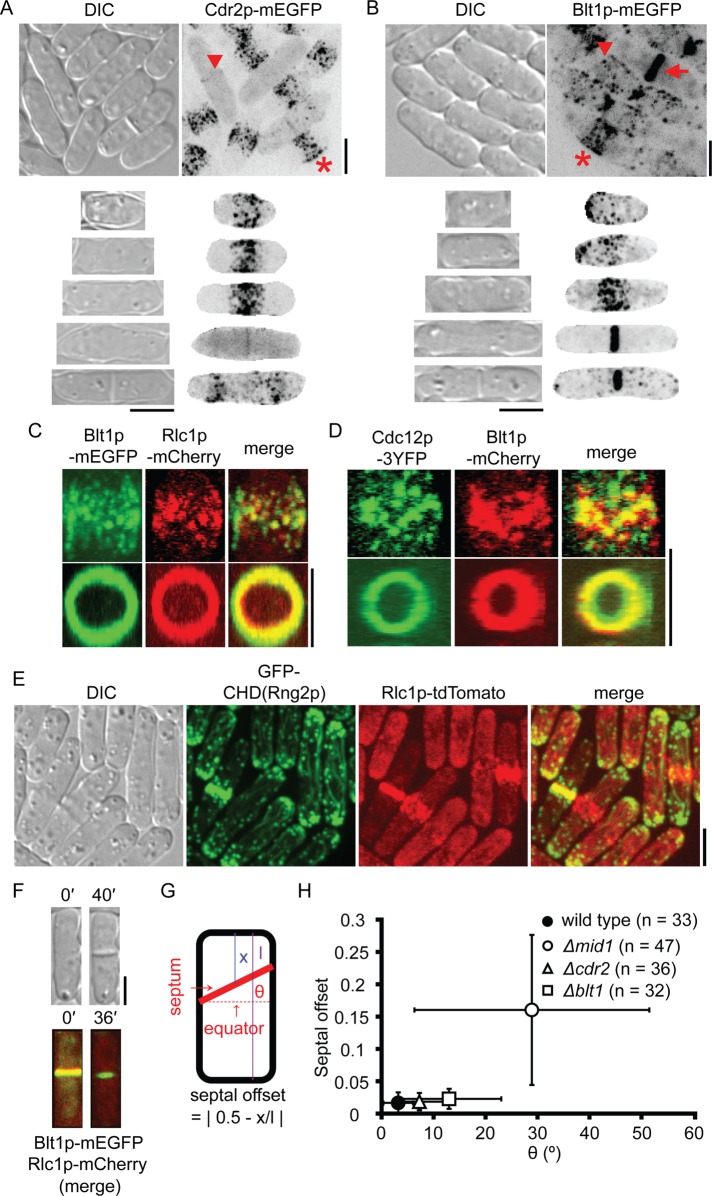
Contractile ring assembly in wild-type cells. (A, B) Differential interference contrast (DIC) and maximum-intensity projections of negative-contrast fluorescence micrographs. Top, fields of unsynchronized cells. Rows 2–6 show individual cells of different lengths representing successive stages of the cell cycle. Regions outside the cells are masked in the fluorescence micrographs in rows 2–6. (A) Cdr2p-mEGFP concentrates in nodes that form a broad band in short cells (star) and a faint band in the middle of some long cells (arrowhead). (B) Nodes marked with Blt1p-mEGFP cluster close to the new pole just after division and then disperse in the cortex (arrowhead) and form a broad equatorial band in mitosis (star) that subsequently coalesces into contractile ring (arrow). (C, D) Two-dimensional projections of fluorescence micrographs of parts of different wild-type cells showing (C) Blt1p-mEGFP and Rlc1p-mCherry and (D) Cdc12p-3YFP and Blt1p-mCherry colocalizing in nodes (top row) and contractile ring (bottom row). (E) DIC and two-dimensional projections of fluorescence micrographs showing cells with Rlc1p-tdTomato expressed from the native locus and GFP–calponin-homology domain (CHD) of Rng2p expressed from a 41xnmt1 promoter for 24 h. (F) DIC and maximum-intensity projections of fluorescence micrographs of a cell expressing Blt1p-mEGFP and Rlc1p-mCherry. Images taken 40 min apart show constriction of the contractile ring and formation of a septum. (G) Cartoon of S. pombe defining septal offset and septum tilt angle θ. (H) Plot of septal offset vs. θ for cylindrical or near-cylindrical cells containing single septum. The larger value of θ was scored for curved septa intersecting two sides of a cell at different angles: (●, n = 33) wild-type cells, (◯, n = 47) Δmid1 cells, (∆, n = 36) Δcdr2 cells, and (□, n = 32) Δblt1 cells. Error bars, 1 SD. Scale bars, 5 μm. See also Supplemental Figure S1 and Supplemental Videos S1–S4.

