FIGURE 2:
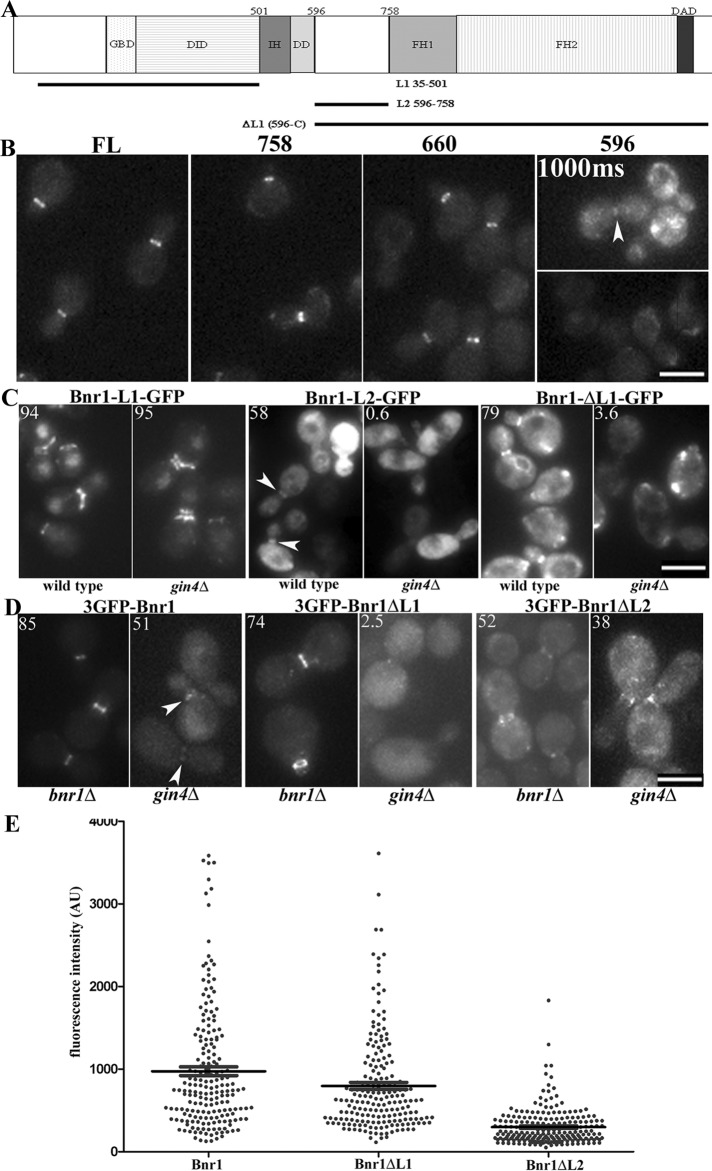
The Gin4 effect on Bnr1 localization is mediated by the L2 domain of Bnr1. (A) Domain architecture of Bnr1. DAD, Diaphanous autoregulatory domain; DD, dimerization domain; DID, Diaphanous inhibitory domain; FH1, formin homology 1; FH2, formin homology 2; GBD, GTPase-binding domain; IH, interdomain helix. The truncations used in the experiments in C are indicated. (B) Endogenous-level expression of Bnr1-758–GFP or Bnr1-660–GFP defines a minimal localization signal for Bnr1. Images are maximum-intensity projections with normalized fluorescence intensity. (C) C-terminally GFP-tagged Bnr1 constructs containing either L1 or L2 were expressed from the inducible GAL1,10 promoter. Bnr1 L2 (596–758) requires Gin4 for localization to the bud neck. Cells were fixed after 1 h (L2) or 4 h (L1 and ΔL1) of induction with medium containing 2% galactose. (D) Endogenous-level Bnr1 constructs confirm a requirement for Bnr1-L2 for Gin4-dependent localization to the bud neck. Note that images were chosen to represent the fluorescence intensity of the Bnr1 constructs rather than the percentage of Bnr1 localized to the bud neck. (C, D) Number in the upper left indicates the average percentage of cells with Bnr1 localized to the bud neck (n > 100 cells; three independent experiments). (B–D) Cells were imaged in three dimensions with five 0.5-μm stacks using the same exposure conditions for all experiments. Images are normalized, maximum-projection images; scale bar, 5 μm. (E) Fluorescence intensity of full-length 3GFP-Bnr1, 3GFP-Bnr1-ΔL1, or 3GFP-Bnr1-ΔL2 measured from the images obtained for bnr1Δ strains as in D. Each point represents the background-subtracted fluorescence intensity of a single cell (in arbitrary units); bars, mean ± SE.

