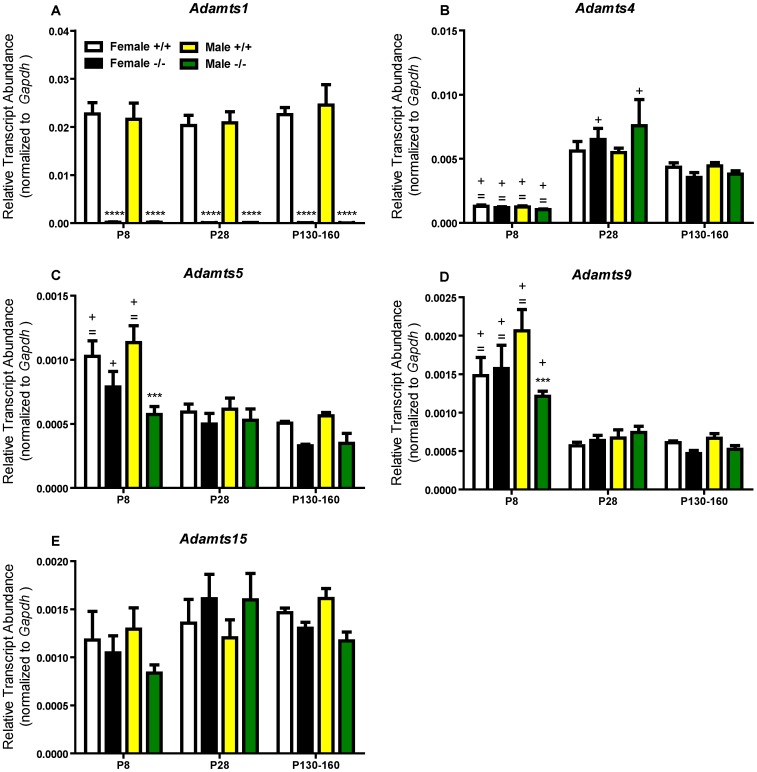
Figure 1. Relative transcript abundance of Adamts genes in the ADAMTS1 null and wildtype frontal cortex.
Relative transcript abundance for (A) Adamts1, (B) Adamts4 (C) Adamts5, (D) Adamts9, and (E) Adamts15 at P8, P28, and P130–160 in ADAMTS1 null (−/−) and wildtype (+/+) frontal cortex as measured by quantitative RT-PCR using TaqMan assays. For each sample (n = 4–7 at each age, sex, and genotype), the logarithmic Ct value was converted to the linear form with 2−Ct and then divided by the linear Gapdh value to obtain relative transcript abundance normalized to Gapdh. For each gene, ADAMTS1 null and wildtype values (separated by sex) were compared with two-way ANOVA (genotype×age) followed by Bonferroni pairwise comparison; ***p<0.001 and ****p<0.0001 indicate a difference from the same sex and age wildtype mice; = p<0.05 indicates a significant difference from the same sex and genotype P28 average; +p<0.05 indicates a significant difference from the same sex and genotype P130–160 average.

