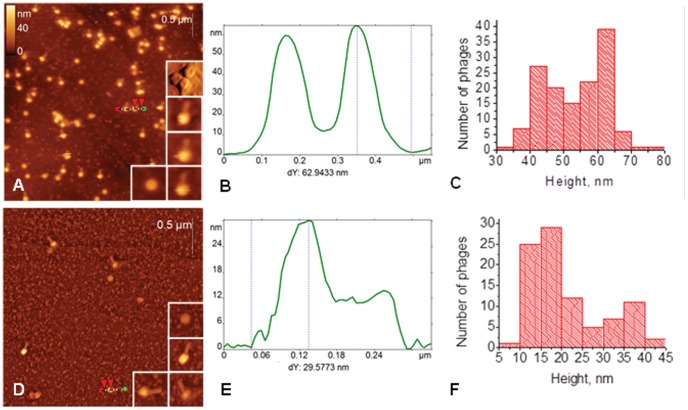
Figure 3. AFM images of bacteriophages AP22.
AFM height images (A, D), section analysis (B, E) and height distribution histograms (C, F) of bacteriophages AP22 deposited on the mica (top row) and HOPG (bottom row) surfaces. Sections are built along the dotted lines on the corresponding AFM images. Insets in A and D demonstrate zoomed bacteriophages from the same image. Top inset in A is presented in deflection channel to emphasize holes in the center of the phages.

