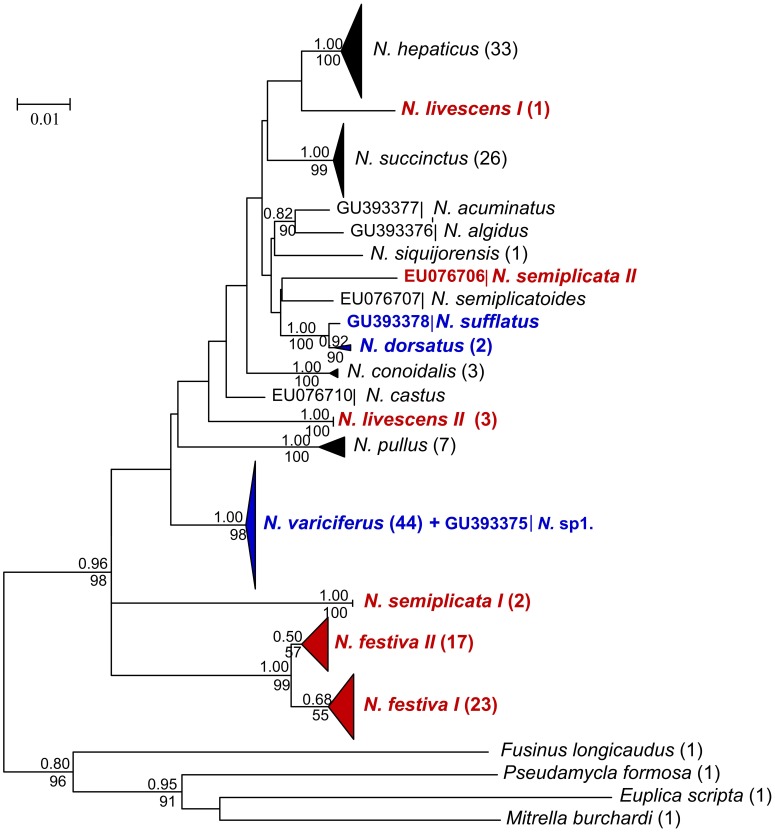
Figure 4. Bayesian tree of the 16S rDNA locus.
Posterior probabilities and bootstrap values were included. The number of individuals included in each species was shown in brackets by the species name. Species showing cryptic diversity were marked in red. Species that could be identified as synonyms were marked in blue.

