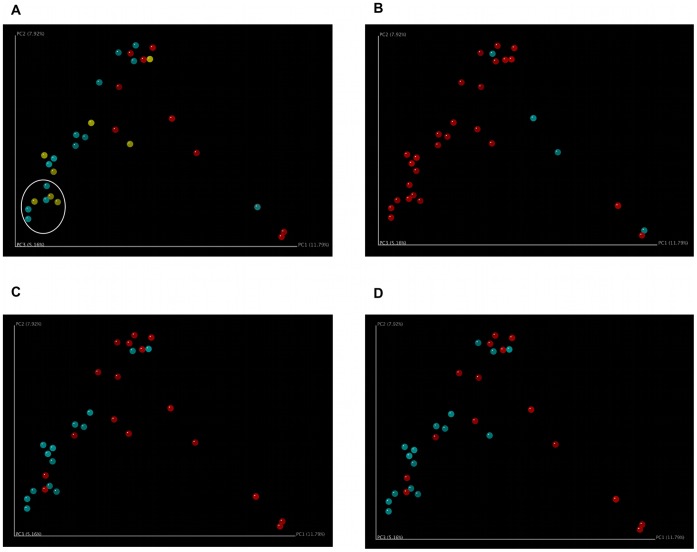
Figure 2. Principal Coordinate Analysis Demonstrates Clustering of COPD Samples, Inhaled Corticosteroid Users, and Inhaled Bronchodilator Users.
Principal coordinate analysis was performed using mothur and Fast UniFrac, and the results for principal coordinates 1 and 2 are shown. A. Control, Moderate COPD, and Severe COPD. Control samples (red) cluster separately from Moderate COPD (blue) and Severe COPD (yellow) samples. Moderate and Severe COPD samples do not cluster separately. Seven COPD samples that separate the most from the control samples are circled and designated “left lower quadrant” (LLQ) samples for further analysis. B. Smokers and Non-Smokers. Smokers (blue) do not cluster separately from Non-Smokers (red). All of the COPD patients had been non-smokers for at least 6 months prior to bronchoscopy. C. Inhaled Corticosteroid Users and Non-Users. Inhaled corticosteroid users (blue, 14 of 22 COPD patients) are more likely to cluster near the intersection of principal coordinates 1 and 2 than non-users (red). D. Inhaled Bronchodilator Users and Non-Users. Inhaled bronchodilator users (blue, 16 of 22 COPD patients) are more likely to cluster near the intersection of principal coordinates 1 and 2 than non-users (red). All patients who received inhaled corticosteroids also received inhaled bronchodilators.

