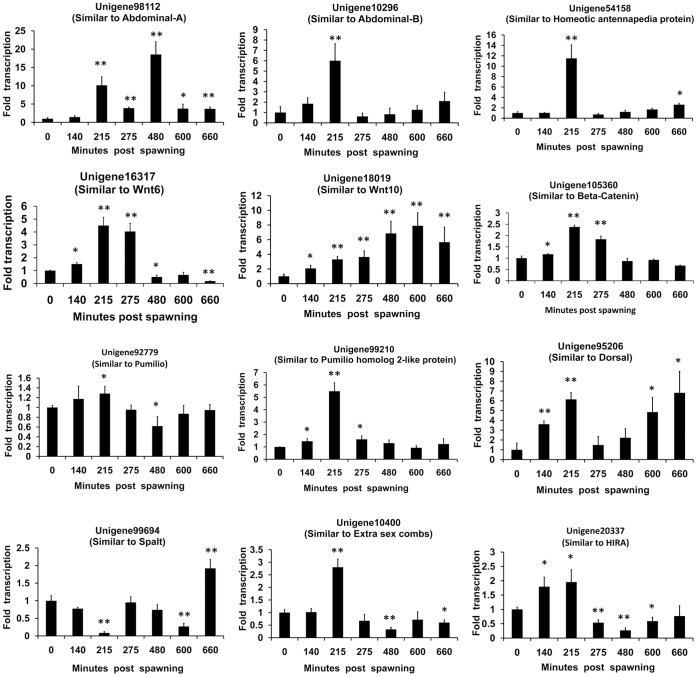
Figure 9. Real-time PCR analyses of the expression profiles of 12 assembled unigenes during embryos development.
Experiments were performed in triplicate and repeated three times with similar results. Bars display mean+s.d., and statistical analysis was performed using Student’s T test and the P values were provided (**, P<0.01; *, P<0.05).

