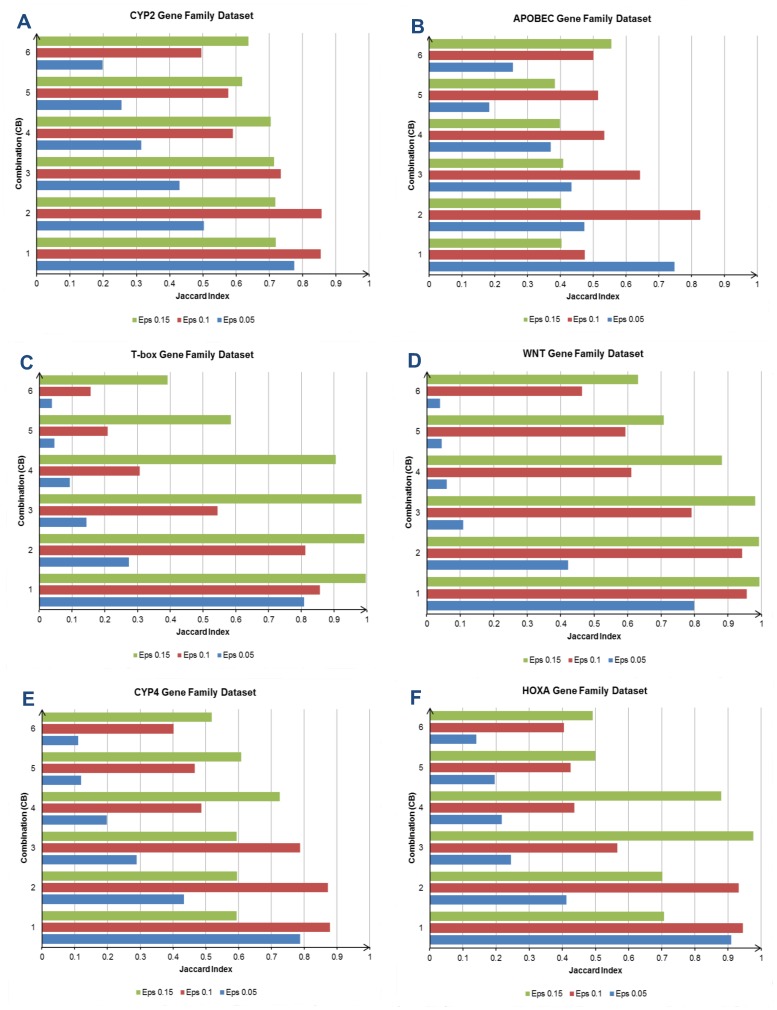
Figure 6. The clustering results (Jaccard Index) for the six experimental EST datasets.
Graph (A) represents the clustering result for the CYP2 dataset. The best performer is the test with combination CB2 and neighborhood distance (Eps) 0.1. (B) is the clustering result for the APOBEC dataset, and the highest clustering accuracy is also achieved by the test with CB2 and Eps 0.1. The clustering result for the T-box dataset is plotted in (C). The test with CB1 and Eps 0.15 scores the highest clustering accuracy in this dataset. (D)–(F) show the clustering results for the WNT, CYP4 and HOXA datasets. Three tests (CB1–CB3, all with Eps 0.15) yield clustering accuracy above 0.98 in the WNT dataset. In the CYP4 dataset, the test with CB1 and Eps 0.1 records the highest clustering accuracy. The test with CB3 and Eps 0.15 outperforms other tests in the HOXA dataset.

