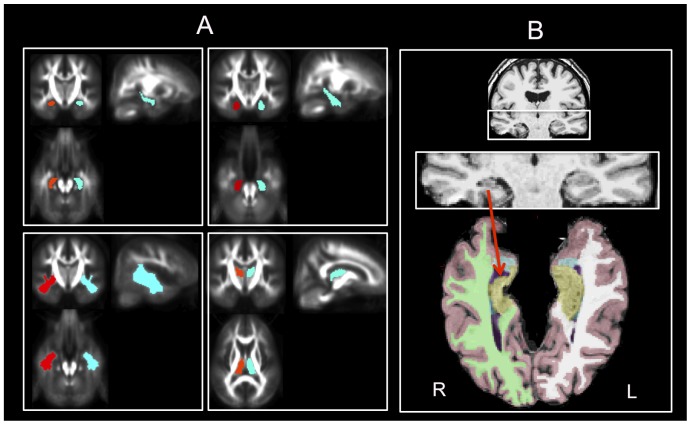
Figure 1. DTI and volumetric ROI approaches.
A. Masks used for calculation of ROI mean FA. Examples shown are hippocampus (i), parahippocampal gyrus (ii), temporal lobe white matter (iii), and thalamus (iv). B. Automated labelling and volume estimation using FreeSurfer in a patient with right TLEhs. A supratentorial axial view (with infratentorial brain removed) is used to emphasize right hippocampal atrophy (red arrow) in this case. Yellow = hippocampus, blue = amygdala, purple = lateral ventricle, green/white = right/left cerebral white matter, pink = cortex. R, right. L, left.

