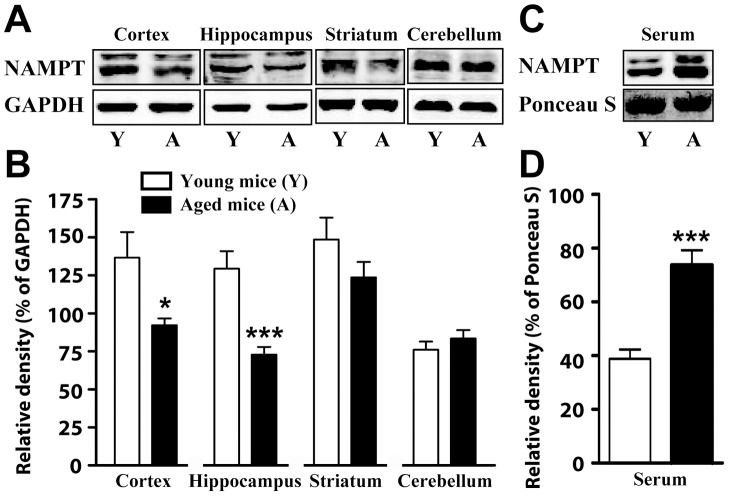
Figure 1. NAMPT expression in blood serum and brain regions for young and aged mice.
A) Representative immunoblots of NAMPT and GAPDH expression in cortex, hippocampus, striatum and cerebellum. B) Statistical analyses of NAMPT expression in A. C) Representative immunoblots of NAMPT expression and ponceau staining in blood serum. D) statistical analyses of NAMPT expression in C. N = 10 for young mice and 11 for aged mice. Mean ± SEM. *P<0.05, ***P<0.001, compared with young mice, unpaired t test.

