
Figure 2. The intracellular level of tNAD in cortex, hippocampus, striatum and cerebellum.
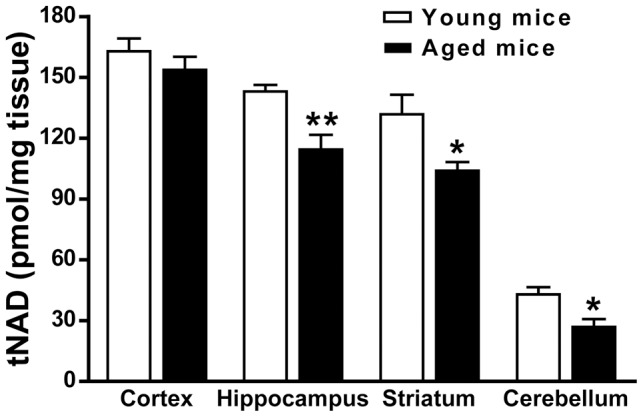
N = 6. Mean ± SEM. *P<0.05, compared with young mice, unpaired t test.
Official websites use .gov
A
.gov website belongs to an official
government organization in the United States.
Secure .gov websites use HTTPS
A lock (
) or https:// means you've safely
connected to the .gov website. Share sensitive
information only on official, secure websites.
N = 6. Mean ± SEM. *P<0.05, compared with young mice, unpaired t test.