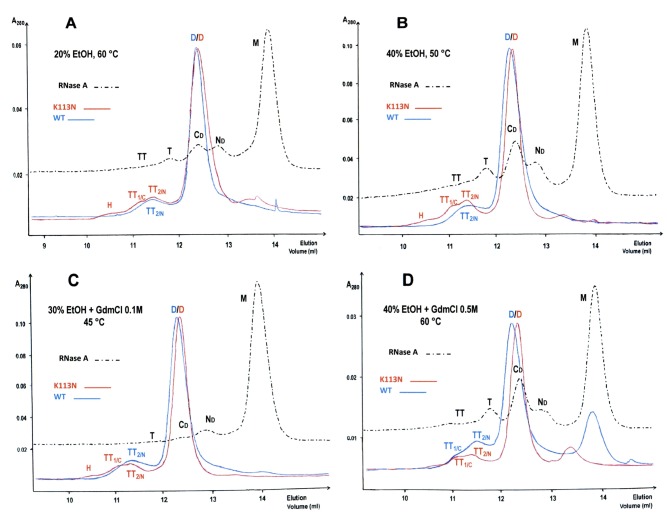
Figure 5. SEC profiles of wt and K113N BS-RNase aggregates obtained through thermal treatment.
The various environmental conditions applied in aqueous solvents [35] are indicated in each of the A–D panels, in which the profiles obtained with the two BS-RNase variants (blue and red curves) are compared with the corresponding RNase A chromatograms (dotted black curves). Oligomers were obtained as follows: tubes containing 2.5–3.0 µl (0.5 mg) of each solution were put for 60 min in a thermostatically controlled bath at one of the temperatures indicated [35]. Then, 200 µl of 0.2 M NaPi, pH 6.7, heated to the same temperature of incubations [35], were added. Each sample was transferred to an ice-cold bath for 5 min, then injected onto a gel filtration Superdex 75 HR10/30 column. The different oligomers formed are labeled and correspond to the ones prepared by the lyophilization procedure (see Figure 1) [11]. GDMCl, guanidine hydrochloride; EtOH, ethanol.

