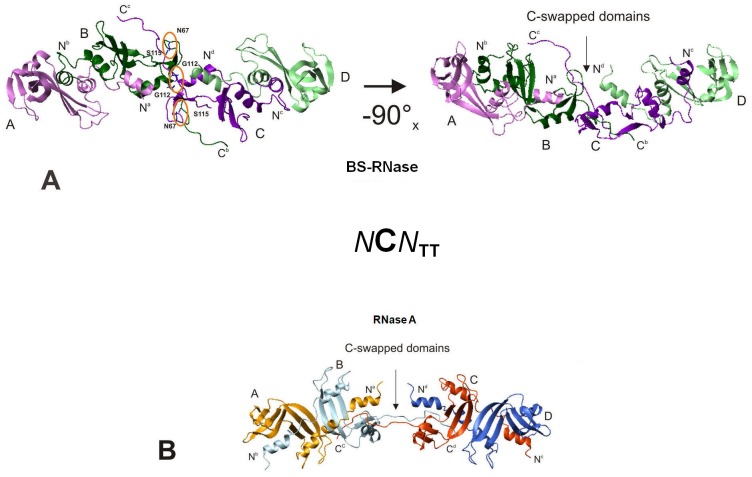
Figure 6. Molecular docking models of NCN-swapped BS-RNase and RNase A.
(A), left panel, “quasi-linear” [40] NCN TT model: the stabilizing intermolecular H-bonds between the two central subunits are indicated with orange circles; right panel, the same structure rotated 90° around the x-axis. (B) modeled structure of RNase A NCN TT [40], [41] reported for comparison.

