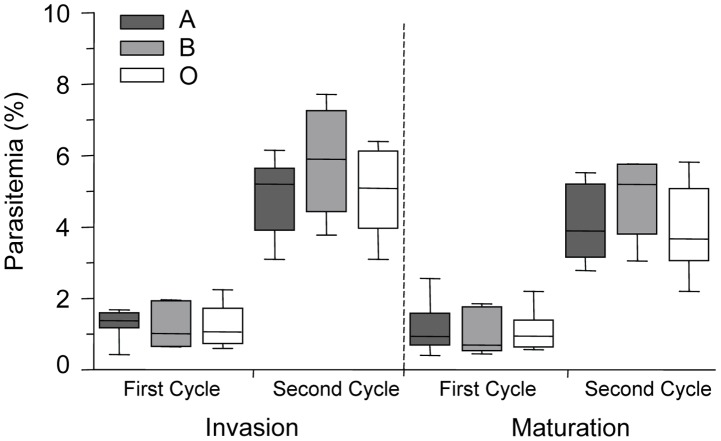
Figure 1. P. falciparum parasite invasion of A, B and O erythrocytes.
Levels of parasite invasion and maturation during two cycles of growth of P. falciparum clone ITG in A, B and O erythrocytes. Data are presented as the combined results of 4 independent experiments using erythrocytes from healthy human volunteers with blood groups A (n = 7 donors), B (n = 4 donors) and O (n = 6 donors). Data are shown as box-and-whiskers plots, representing interquartile and complete ranges, with the horizontal line in each box indicating the median. Statistical significance was determined by a one way ANOVA. Invasion is defined as the percentage of ring parasitemia, as measured 24 hours and 72 hours after inoculation. Maturation is defined as the percentage of trophozoite parasitemia, as measured 48 hours and 96 hours after inoculation. There were no significant differences observed in the invasion and maturation of P. falciparum parasites in A, B or O erythrocytes.

