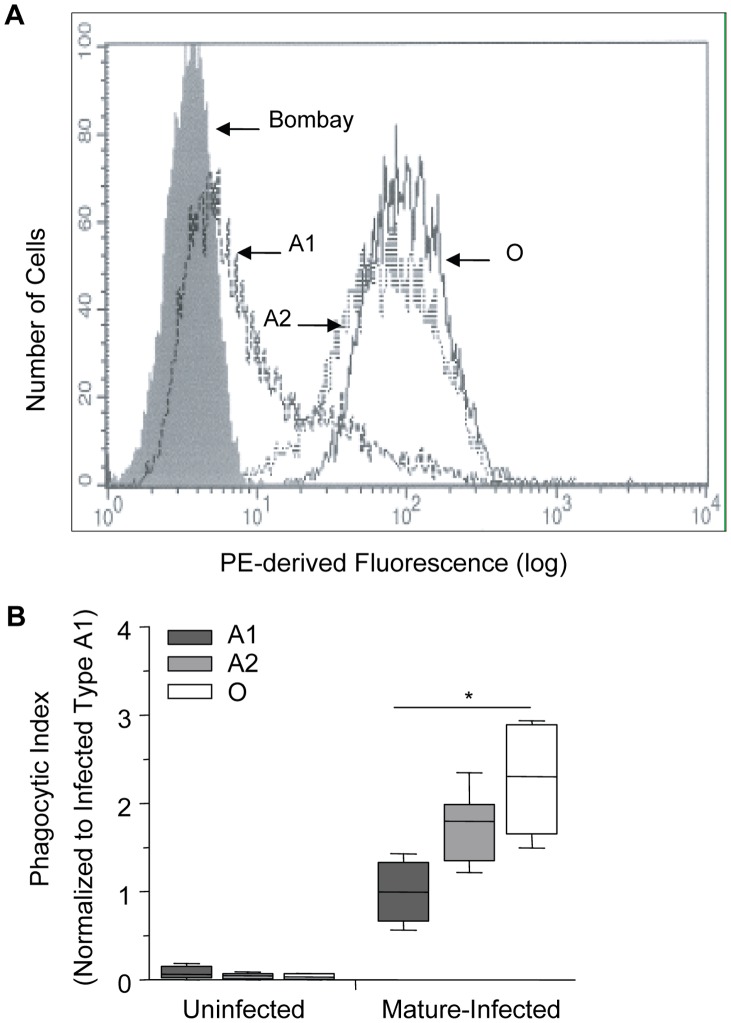
Figure 4. Increasing phagocytosis of erythrocytes correlates with decreasing A antigen.
A and O erythrocytes were typed using standard hemagglutinin techniques. Blood group A was further classified into A1 or A2 subgroups using Dolichos biflorus lectin. (A) Flow cytometric testing of A1, A2, O, and Bombay erythrocytes with anti-H (clone BRIC231) FITC conjugated antibody. FITC-derived fluorescence is displayed on the x axis on a logarithmic scale and the number of cells on the y axis. O (solid black line), A2 (dotted black line), A1 (dashed black line) and Bombay (filled grey). (B) A1, A2 and O erythrocytes infected with P. falciparum (ITG clone) were incubated with human monocyte-derived macrophages. The phagocytic index was calculated by determining the number of internalized parasitized erythrocytes within 250 macrophages. Data were normalized to the average phagocytic index of infected A1 cells. Data represent 3 independent experiments and each blood group is represented by multiple donors, A1 (n = 8/group), A2 (n = 3/group), and O (n = 8/group). The box plots represent the median, interquartile and complete range. The phagocytosis of infected erythrocytes increased in an H antigen dose-dependent manner (r = 0.80, *p<0.0001; Spearman's correlation test).

