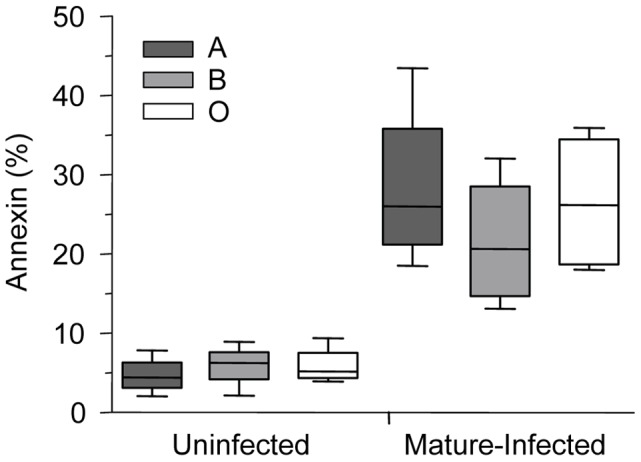
Figure 6. Phosphatidylserine levels on P. falciparum-infected A, B and O erythrocytes.

Annexin staining of A, B and O uninfected and P. falciparum-infected erythrocytes was evaluated. Freshly purified erythrocytes (n = 4 for each group) from healthy donors were left uninfected or were infected with ITG, 3D7 or E8B clones and stained by annexin-V-FITC and propidium iodide and analyzed by flow cytometry. Data are shown as box-and-whiskers plots, representing interquartile and complete ranges, with the horizontal line in each box indicating the median level of percentage of annexin-V positive cells among total cell population. There were no significant differences observed between infected A, B, or O group erythrocytes.
