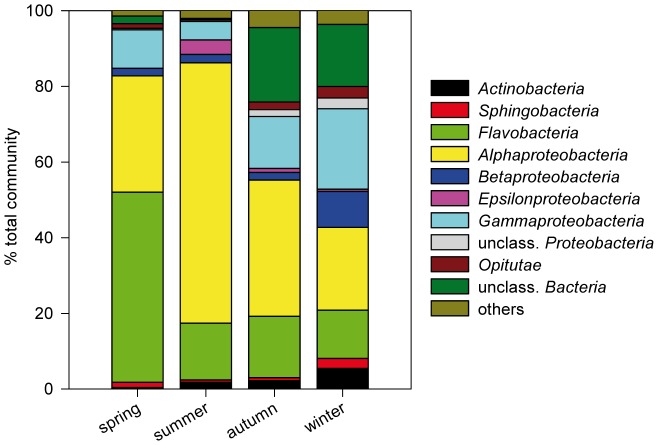
Figure 1. Relative abundance of bacterial classes in the starting communities (seawater fraction <10 µm).
The chart was constructed based on the relative abundances of OTUs (16S ribosomal amplicon pyrosequencing) in the standardized subsample (n = 494 sequences). Classes represented by less than 2% of sequences are summarized under “others”.

