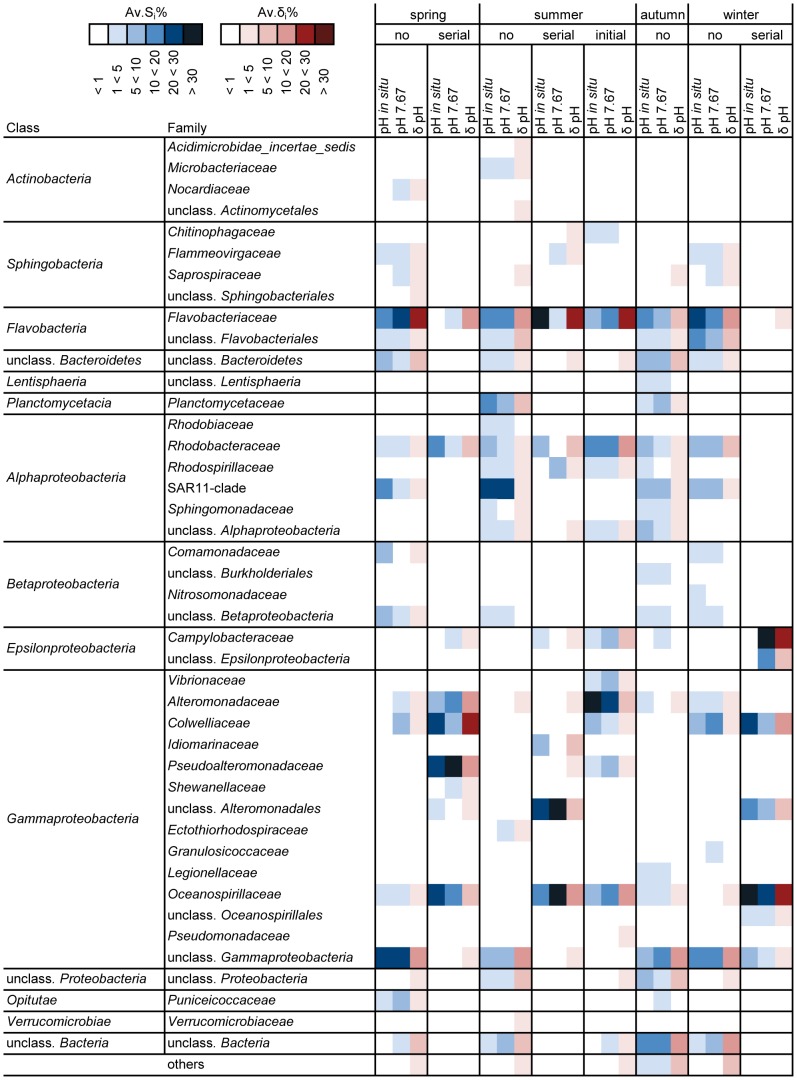
Figure 3. Bacterial groups responding differently to pH, based on SIMPER analysis.
Displayed are phylogenetic groups jointly contributing to 90% of the total similarity within and dissimilarity between pH levels, separately for each ‘season’-‘dilution’ combination (no: ‘no dilution’, serial: ‘serial dilution’, initial: ‘initial dilution’). The heat map summarizes the contributions of single OTUs (16S ribosomal amplicon pyrosequencing) on the family level. Av.Si%: average percentage contribution of the i th species to the total similarity, Av.δi%: average percentage contribution of the i th species to the total dissimilarity. Bacterial families contributing less than 1% to both totals are summarized under “others”. The amount of contribution is indicated by the color of cells, darker colors represent higher contributions.

