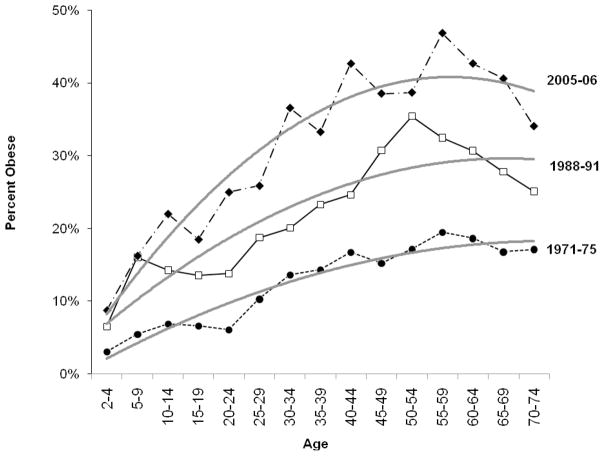
Figure 1. Prevalence of Obesity in the United States (1971–2006), by Age & by Period* (N=91,755).
*Data come from select waves of the NHANES data collection: NHANES I 1971–1975, NHANES III, Phase I (1991–1994), and NHANES continuous surveys conducted from 2001–2005. The plots for the other waves (NHANES II, NHANES III, Phase II, and NHANES 1999–2000) have been excluded to simplify the presentation. Estimates exclude known pregnant women and non-U.S. born residents and have been weighted to be nationally representative.

