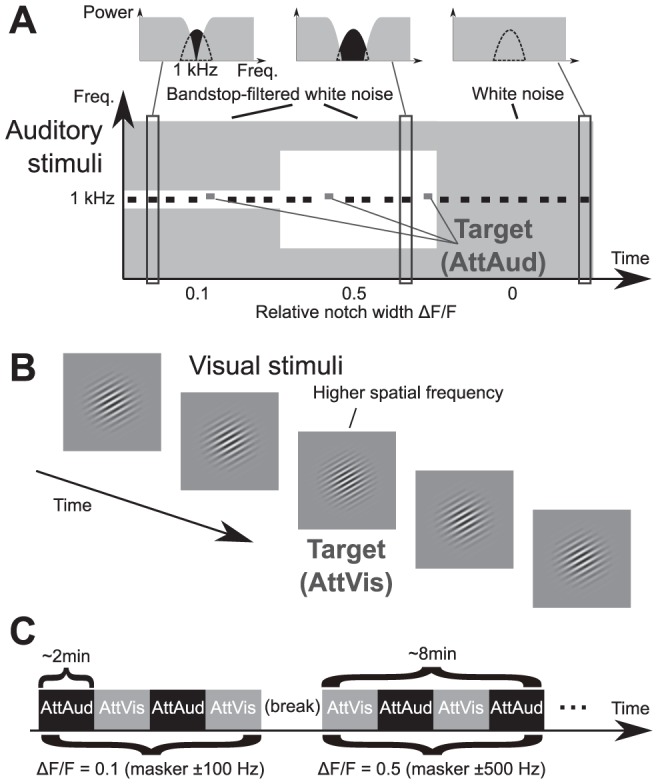
Figure 1. A schematic illustration of the paradigm.

(A) During selective auditory attention (AttAud condition), subjects attempted to detect higher-frequency target tones. The background grey represents the noise masker, while the white area represents the frequency gaps in the noise. (B) During visual attention (AttVis condition), target stimuli with higher spatial frequency were to be detected. Auditory and visual stimuli were identical in both conditions. (C) Each masker type was presented for about 8 minutes, with AttAud and AttVis conditions alternating every 2 minutes, indicated by instructions on the screen during the condition start and change.
