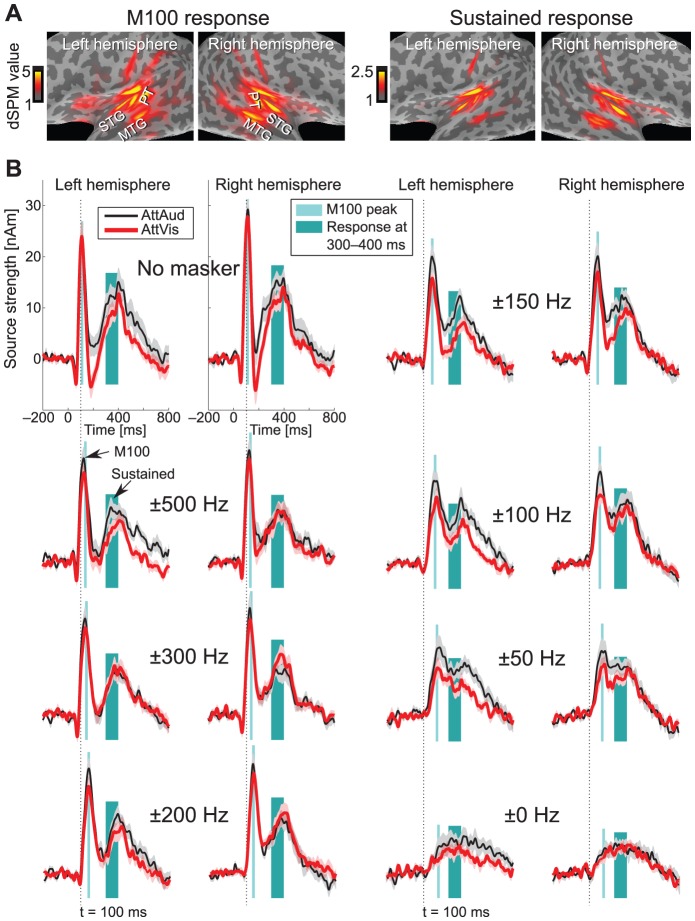
Figure 2. Response suppression due to masking.
(A) Grand average (N = 10) dSPM snapshots of activation with AttAud condition. These illustrate the M100 (latency 123 ms) and sustained response activity (mean of latency range 300–400 ms) during playback of the masker with widest notch ( 500 Hz). Activations are shown on an inflated cortical surface, darker gray areas corresponding to sulci and lighter areas to gyri. The sustained response shows less background ripple due to averaging of data which in turn increases the signal-to-noise ratio. Note different scales for M100 and sustained response. (B) Grand average (N = 14) source waveforms (
 standard error of the mean, SEM, shaded areas) for each stimulus type, hemisphere and condition, projected through the equivalent current dipoles best explaining M100 responses. The source waveforms illustrate the gradual suppression of response amplitudes and increase in latency with narrower notches. Attentional enhancement of sustained response especially in the left hemisphere is evident. Note that for visualization, source waveforms for sustained responses shown here are projected through M100 dipoles which do not exactly coincide with sustained response activity, but the actual analyses use the more anterior and inferior sustained response dipole.

