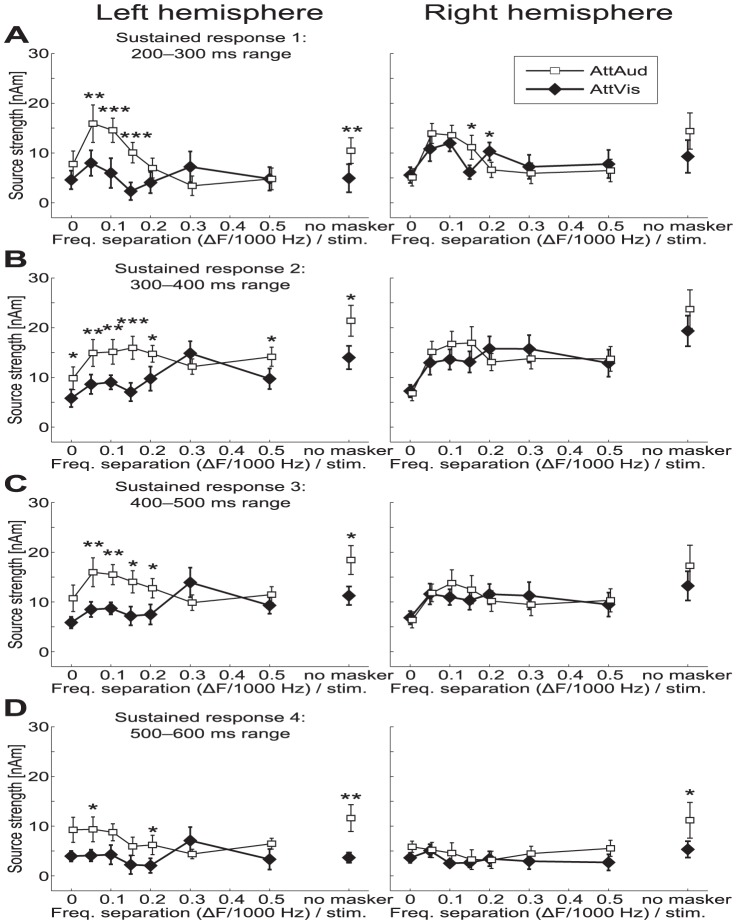
Figure 5. Sustained response amplitudes.
Mean evoked activity ( SEM) from (A) 200–300 ms, (B) 300–400 ms, (C) 400–500 ms, and (D) 500–600 ms time range after the sound onset. We selected (B) as the representative time range for the later analysis (see Materials and Methods). Attentional modulation is strongest in (A)–(C) with some of the narrowest notches (
 50–200 Hz maskers), suggesting increase in feature specificity within the classical critical band of approximately 160 Hz at 1,000 Hz. Significant changes between AttAud and AttVis are indicated by asterisks (*
  , **
, **  , ***
, ***  ).
).

